
 Gallery
List of figures:
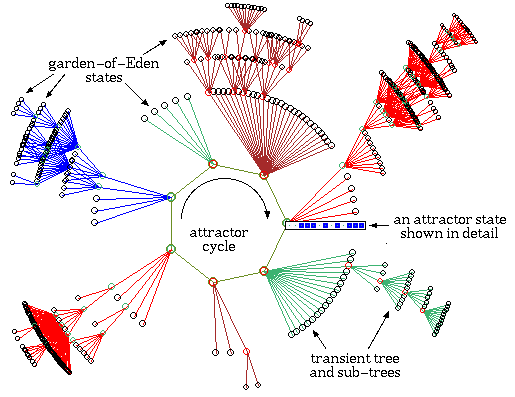
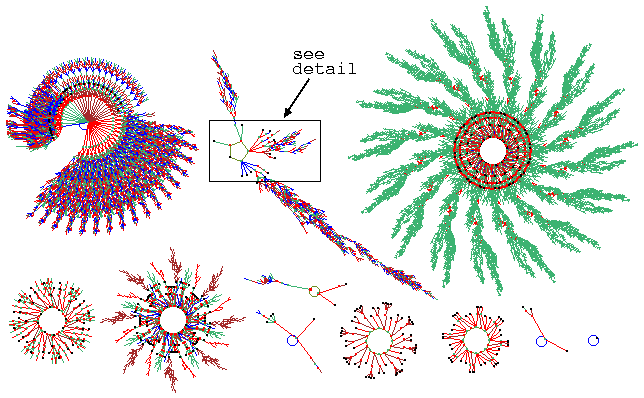
One of the basins of attraction of a random Boolean network.
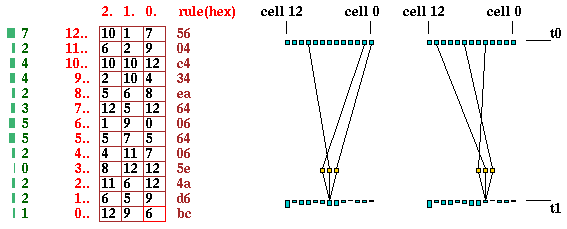
The network size, n=13. The maximum connections (wires) for any cell,
k=3. The complete basin of attraction field of 15 basins is shown
below. The basin links 604 states, of which 523 are garden-of-Eden
states. The attractor cycle has a period of 7. The basin can be
regenerated in DDLab by setting any state belonging to it as the seed,
for example the attractor state shown in detail. The significance of
these "state transition diagrams" is to show how states (the nodes) are
linked by directed arcs (lines). The actual position of nodes and the
length of arcs is set automaticaly in DDLab according to a graphic
convention, where the direction of time is inwards from garden-of-Eden
states to the attractor, then clock-wise.
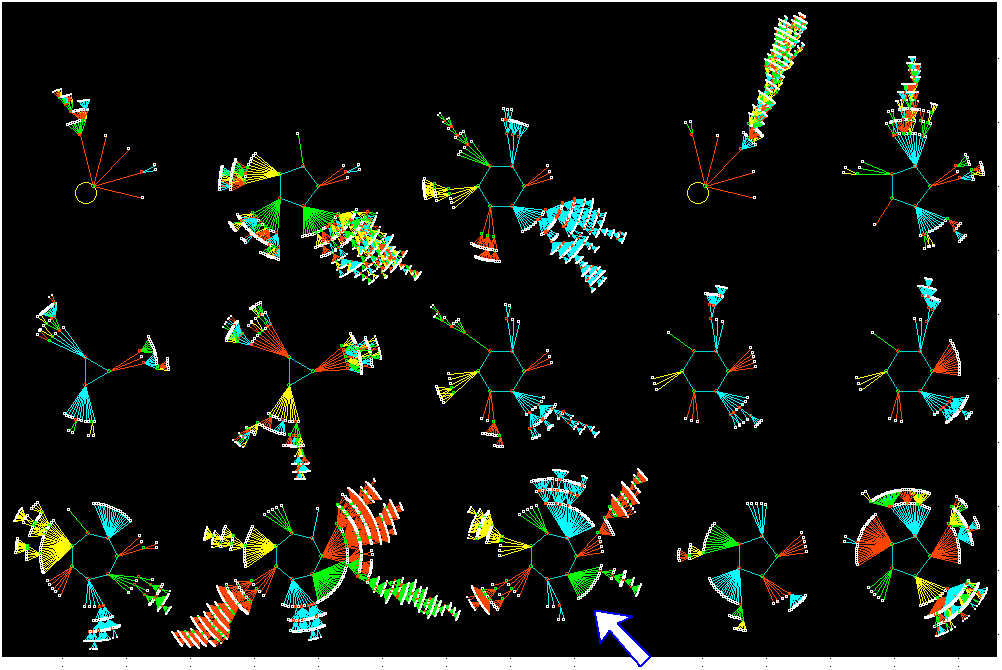
The network's "memory".
The network architecture results in a specific basin of attraction field,
which shows how the network dynamics hierarchically catagorises state-space
into seperate basins, trees and sub-trees, the network's "memory".
Small mutations
to network architecture, for example moving one wire, of flipping
one bit in a rule, will usually have a small effect on the resulting
basin of attraction field, though hitting a sensitive spot can have
drastic consequences. There are also sets of neutral architectures
that produce equivelent basin of attraction fields.
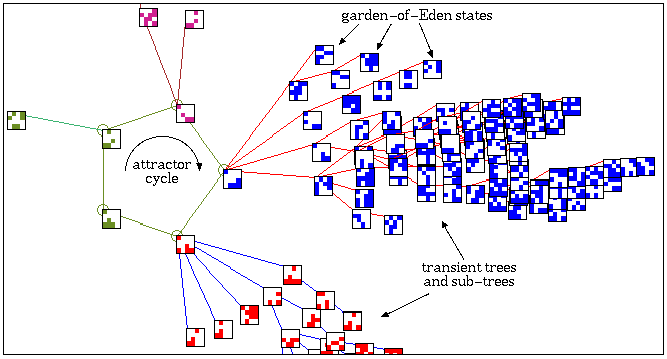
A detail of the 2nd basin in the basin of
attraction field of the CA above.
The states are shown as a 4x4 bit patterns.


| 
| 
| 
| 
| 
| 
| 
| 
| 
| 
| 
| 
| 
| 
|

| 
| 
| 
| 
| 
| 
| 
| 
| 
| 
| 
| 
| 
|
Various predefined neighbourhoods on either a square or hex lattice.
Max-k=13
unless totalistic-rules-only was selected.


| 
|
|
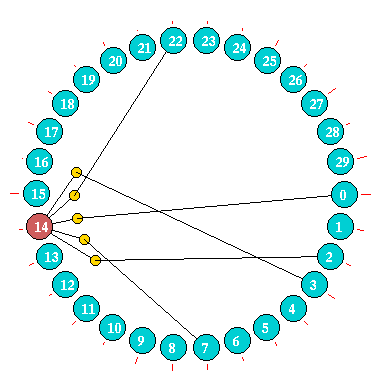
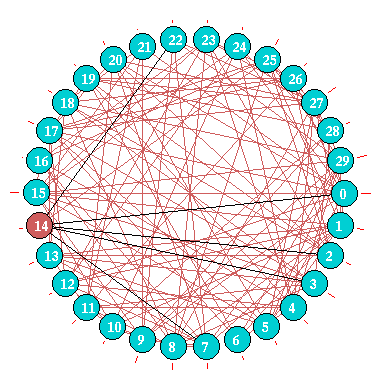
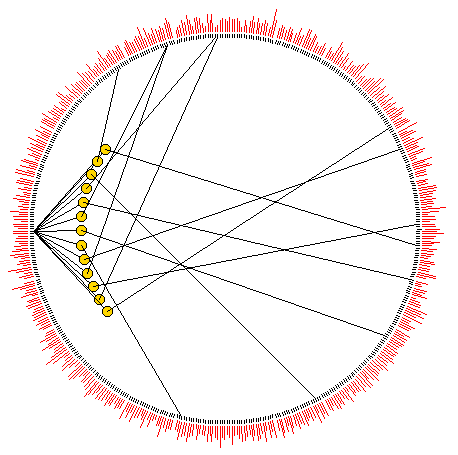
Network wiring can also be represented between cells
arranged in a circle.
For small networks cells are shown a discs, the examples
above are for an RBN, n=30, firstly highlighting just
one cell, then showing the wiring in the whole network.
For larger networks as in the example right for n=500, cells are represented by short radial lines. In both cases the "out-degree" is represented by the radial red lines outside the circle. |
|

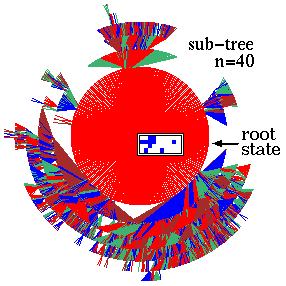
Ordered dynamics. Rule 01dc3610, n=40,
Z=0.5625, lambdaratio=0.668.
below: The complete sub-tree 7 levels deep,
with 58153 nodes, G-density=0.931.
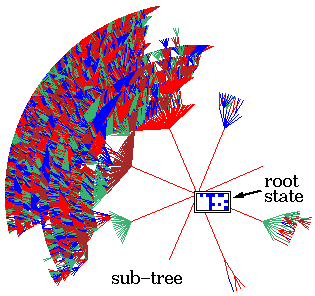
Complex dynamics. Rule 6c1e53a8, n=50,
Z=0.727, lambdaratio=0.938.
below: The sub-tree, stopped after 12
levels, with 144876 nodes, G-density=0.692.
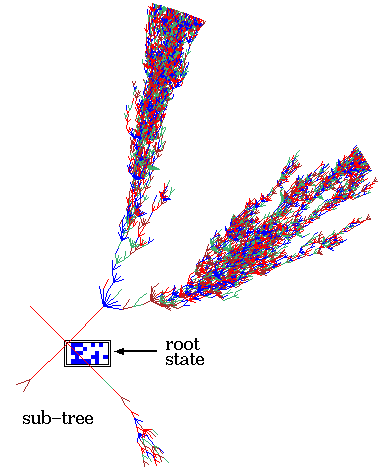
Chaotic dynamics. Rule 994a6a65, n=50,
Z=0.938, lambdaratio=0.938.
below: The sub-tree, stopped after about 75
levels, with 9446 nodes, G-density=0.487.
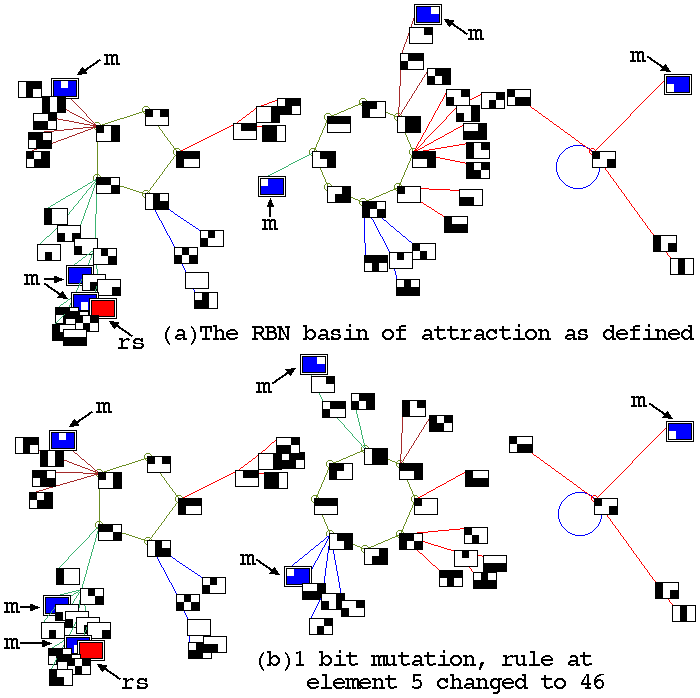
The basin of attraction fields of two RBN (n=6, k=3) with just a 1
bit difference in one of their rules, to illustrate the effect mutation,
and perturbation of a state. Some differences in the fields are
evident. The result of a 1 bit perturbation to a reference state of all
1s (rs) is indicated by the location of its its 1 bit mutants (m).
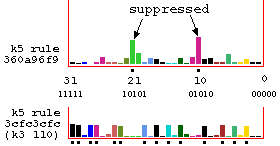
Look-up frequency histograms relating to figure above.
Suppressing neighborhoods are indicated with a dot.
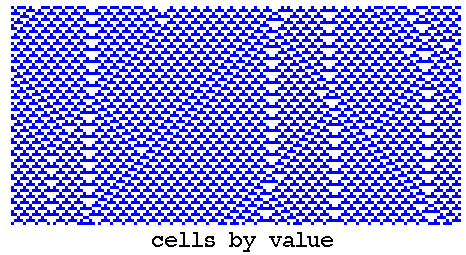
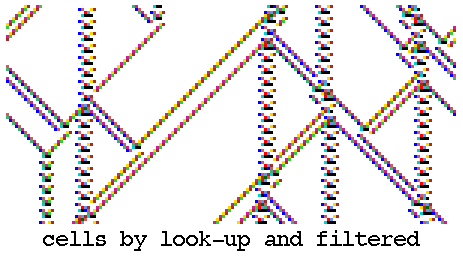
Filtering chaotic domains to show up discontinuities,
k=3 rule 18
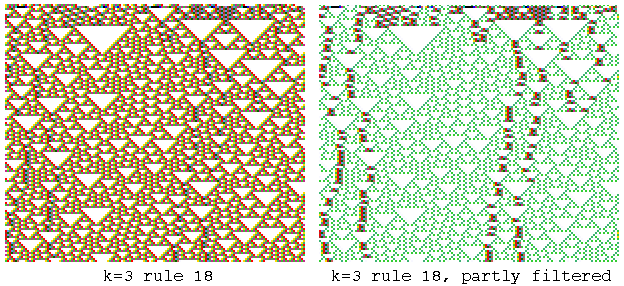
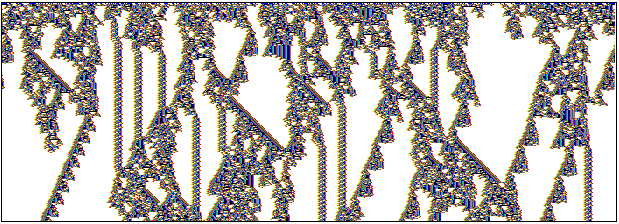
Unfiltered and partly filtered space-time patterns of
k=3 rule 18. (transformed to k=5 rule 030c030c).
n=150, about 130 time-steps from the same random initial
state, showing discontinuities within the chaotic domain.
Interacting Gliders
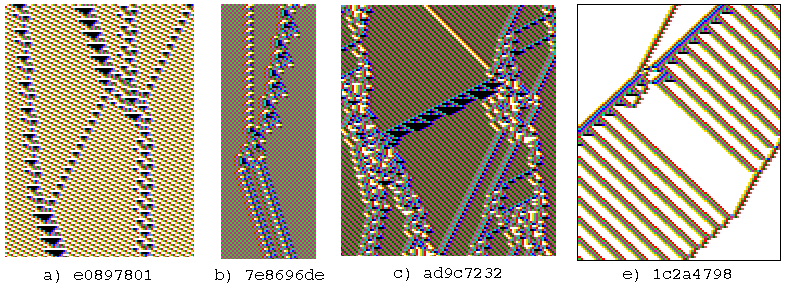
Interacting gliders with various velocities
and backgrounds. 127 time-steps.
The k=5 rule numbers are shown in hex.
Cells are colored according to their look-up neighbourhood.
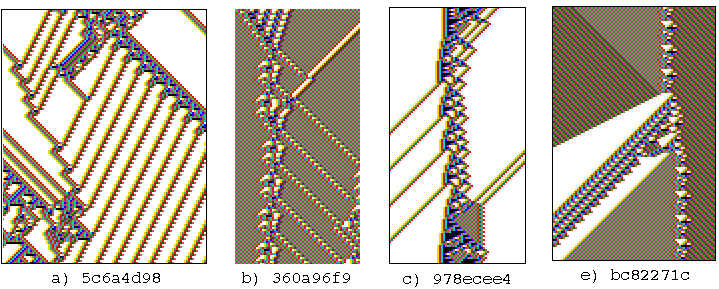
Examples of glider-guns. 127 time-steps.
The k=5 rule numbers are shown in hex.
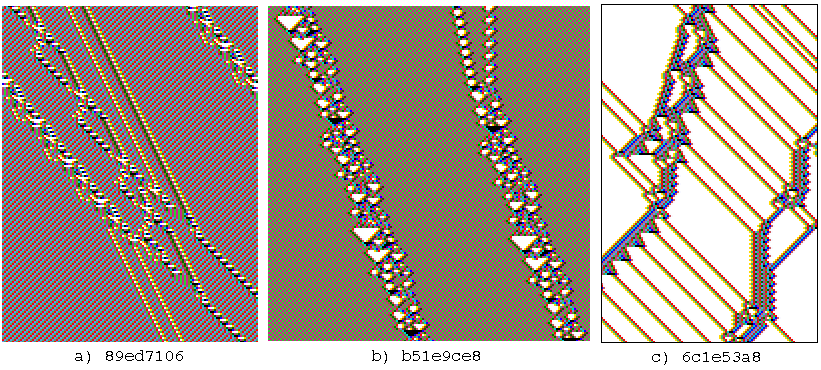
(a) A compound glider, (b) a glider with a period of
106 time-steps, (c) a compound glider-gun. 168 time-steps.
The k=5 rule numbers are shown in hex.
k=5, 6 and 7>
Complex space-time patterns from the automatic sample


Examples of k=5, 6 and 7 complex space-time patterns,
with high standard deviation, from the automatic samples.
n=150, 150 times-steps from random initial states.
Cells are colored according to the neighbourhood look-up.
2d Space-time pattern
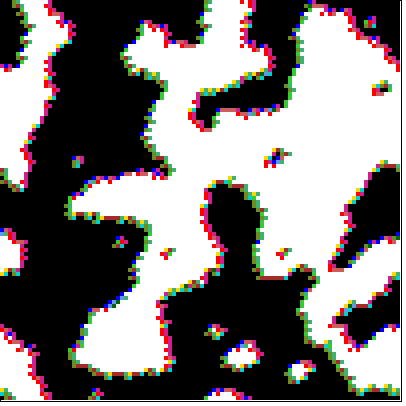
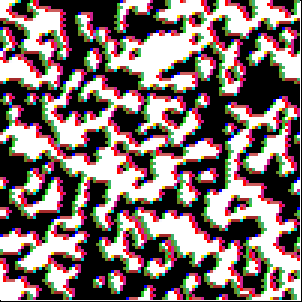
An evolved time-step of a 2d CA on a k=7 100x100 effectively
triangular lattice. left a reaction-diffusion rule,
right the majority rule.
Cells are colored according to their look-up neighbourhood.
2d+time space-time pattern, game-of-Life

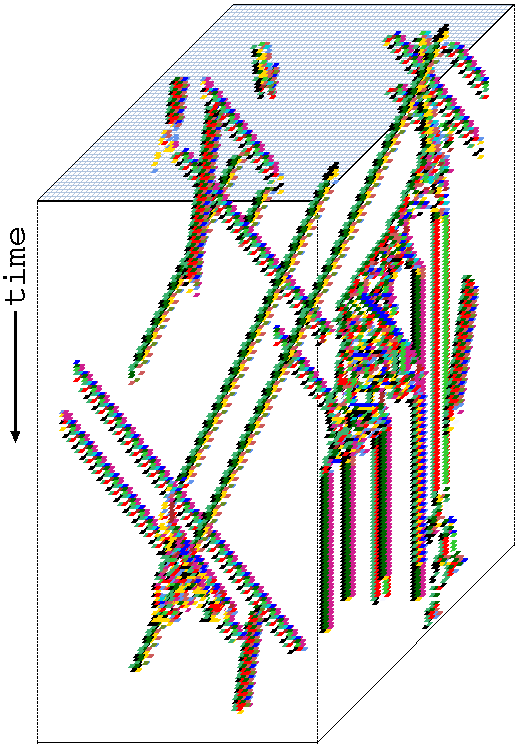
The 2d game-of-Life, with a time dimension added, similar to a 1d
space-time pattern. The projection is axonometric, looking up into a
rectangular cage. Cells are colored according to their look-up
neighbourhood.
left 60x60 grid, starting from the r-pentomino seed.
right 56x56 grid, the initial state is set with a number of
gliders.
3d Space-time patterns
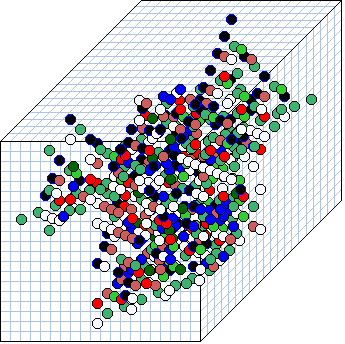
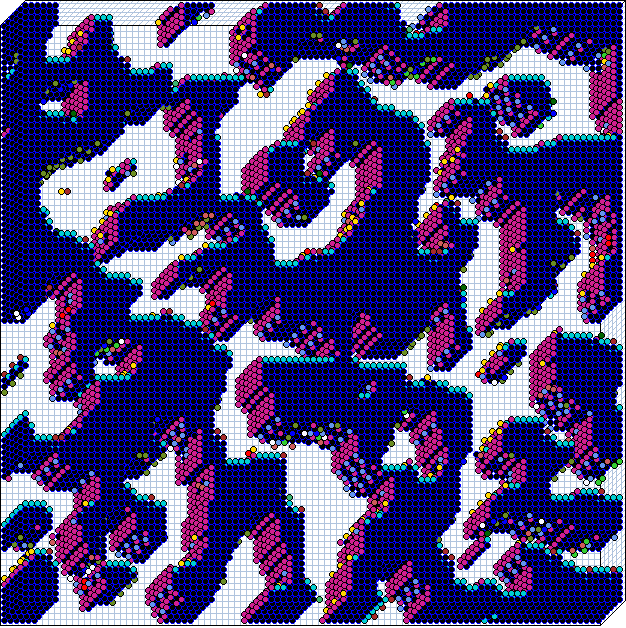
3d Space-time patterns. As in 2d+time, the projection is axonometric,
looking up into a rectangular cage, with periodic boundary
conditions. Cells are colored according to
their look-up neighbourhood.
left A time-step of a 3d k=7 CA 20x20x20, with a
randomly selected rule
and starting from a single central 1.
right
A time-step of a 3d k=7 CA 100x100x7, with a
reaction-diffusion randomly rule
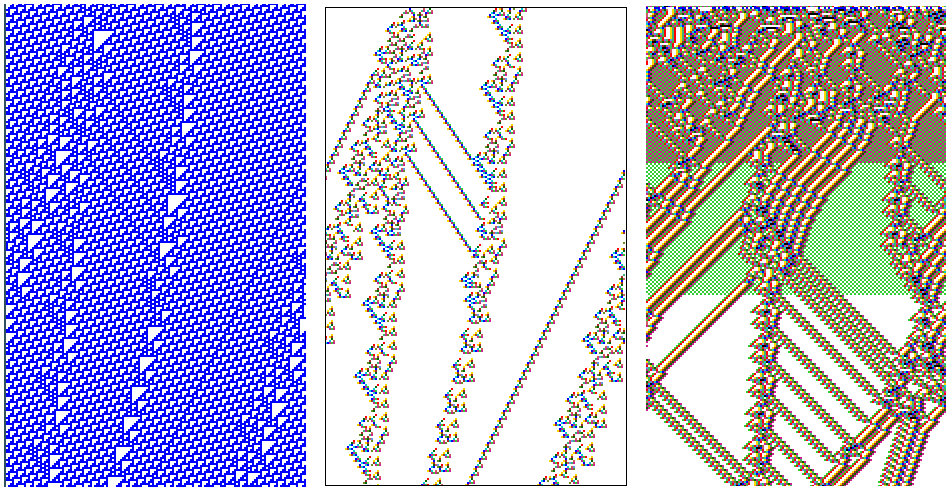
Typical 1d ordered, complex and chaotic Space-time patterns
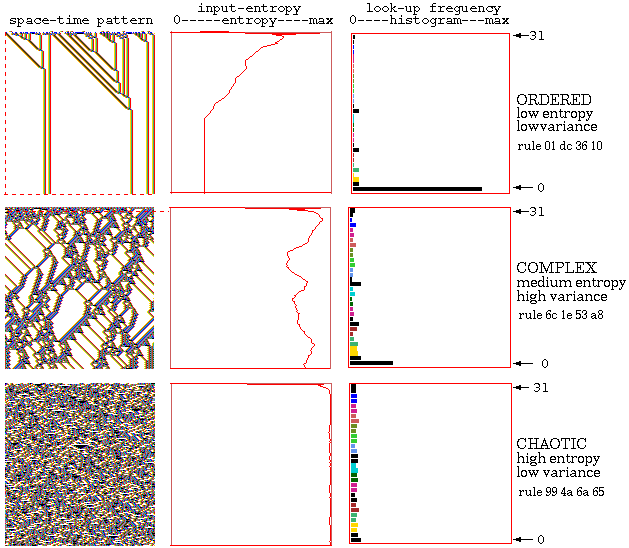
Typical 1d CA Space-time patterns showing ordered, complex and chaotic
dynamics n=150, k=5, rule numbers shown in hex.
Alongside each space-time pattern is a plot of the
input-entropy
taken
over a moving window of 10 time-steps, and a snapshot of the lookup
frequency histogram. In ordered dynamics the entropy quickly settles at
a low value with low or zero variance. In chaotic dynamics the entropy
settles at a high value, but again with low variance. Both ordered and
chaotic dynamics have low input-entropy variance. By contrast, in
complex dynamics the entropy fluctuates erratically both up and down for
an extended time, because glider collisions produce new gliders, often
via a temporary zone of chaotic dynamics. Complex rules can be
recognized by eye, subjectively. Input-entropy variance provides a
non-subjective measure for recognizing complex rules automatically.
Entropy-density scatter plots
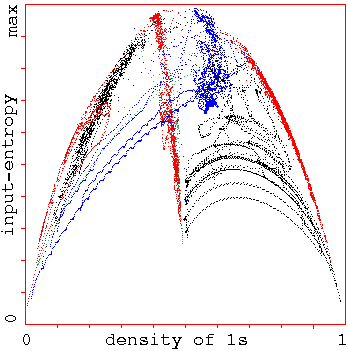
Entropy-density scatter plots. Input-entropy
is plotted against the density of 1s relative to a moving
window of 10 time-steps. k=5, n=150. Plots for a
number of complex rules from the automatic sample are show
superimposed, each of which has its own distinctive
signature, with a marked vertical extent, i.e. high
input-entropy variance. About 1000 time-steps are plotted
from several random initial states for each rule.
Classifying random samples of CA rules automatically
k=5 rules
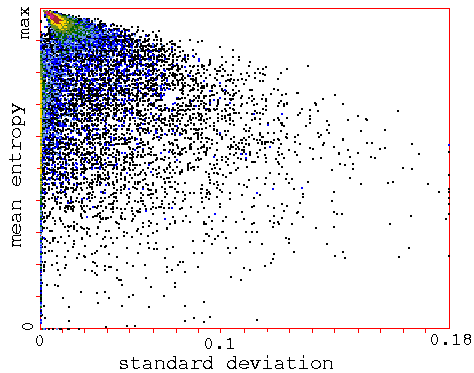
Classifying a
random sample of k=5 rules by plotting
mean entropy against standard deviation of the entropy,
with the frequency of rules within a 128x128 grid indicated
by color.
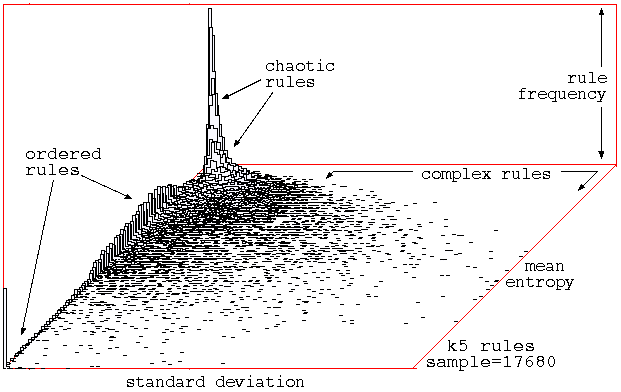
Classifying a
random sample of k=5 rules by plotting
mean entropy against standard deviation of the entropy,
with the frequency of rules within a 128x128 grid shown
on the vertical axis.
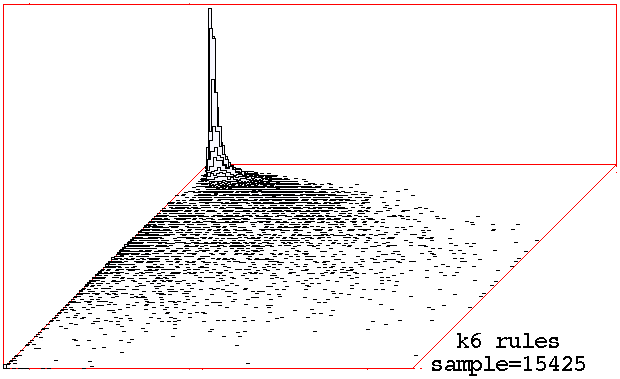
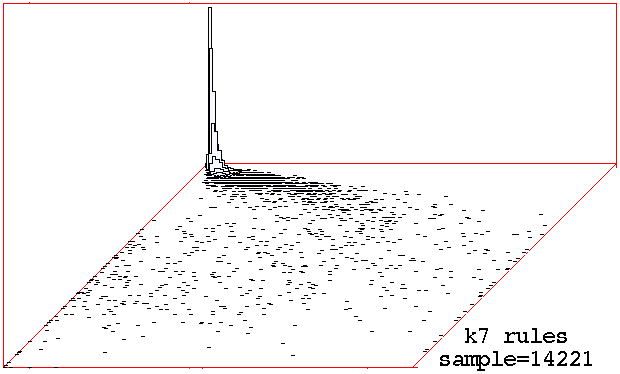
Classifying
random samples of k=6 k=7 rules by plotting
mean entropy against standard deviation of the entropy,
with the frequency of rules within a 128x128 grid shown
on the vertical axis.
Random Boolean Network 1d space-time patterns
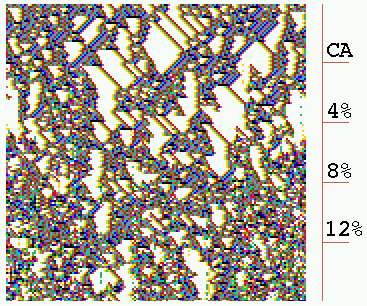
(a) CA - wiring randomised in stages
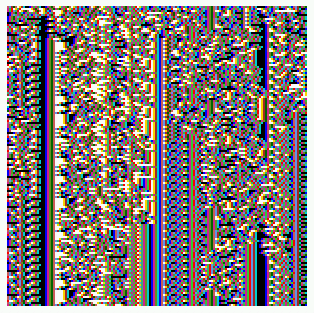
(b) CA wiring, mixed rules
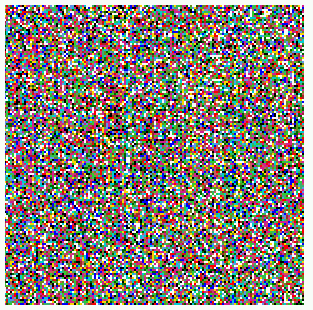
(c) RBN - random wiring, mixed rules
Space-time patterns for intermediate 1d architecture,
from CA to RBN. n=150, k=5, 150 time-steps from a random
initial state. (a) Starting off as a complex CA (rule 6c1e53a8),
4% (30/750) of available wires
are randomized at intervals of 30 time-steps. The coherent pattern is
progressively degraded. (b) A network with local wiring but mixed
rules, vertical features are evident. (c) RBN, random wiring and
mixed rules, with no rule bias, shows maximal chaotic dynamics.
Random Boolean Network order-chaos measures
C = the percentage of canalizing inputs in the randomly biased
network.
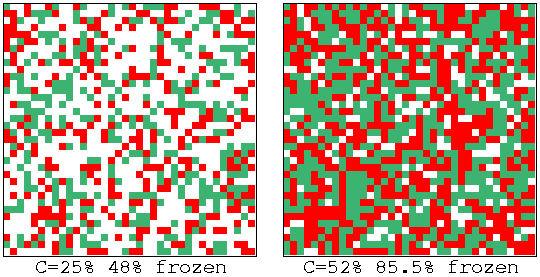
Fozen elements that have stabilized
for 20 time-steps are shown, 0s-green, 1s red, otherwise white,
for left: C=25% and right: 52%.
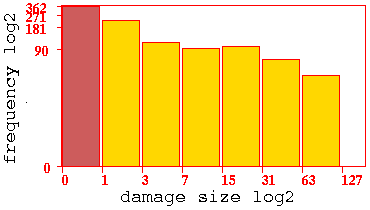
The log-log ``damage
spread'' histogram for C=52%, sample size about 1000.
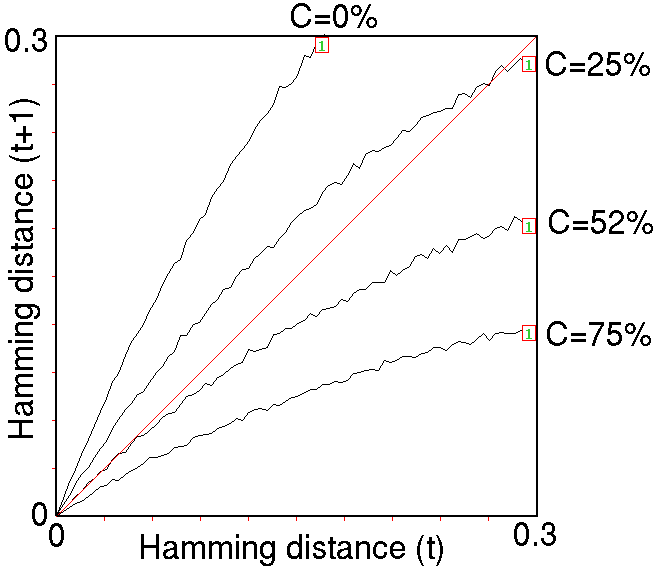
The Derrida plot
for C=0%, 25%, 52%, and 75%, for
1 time-step, Ht=0-0.3, interval = 5,
sample for each Ht =25.
Statistical data on attractor basins for a large networks

Statistical data on attractor basins for a large network;
a 2d RBN 20x20, k=5, with fully random wiring and a
fraction of canalizing inputs C=50%. A histogram of attractor
types was plotted, showing the frequency of reaching each type from
12,360 random initial states, sorted by frequency. 46 different
attractors types where found, their periods ranging from 4 to 102,
with average transient length from 21 to 113 time steps.
The frequency of
arriving at each attractor type indicates the relative size of the
basin of attraction.
G-density against both lambdaratio
and Z
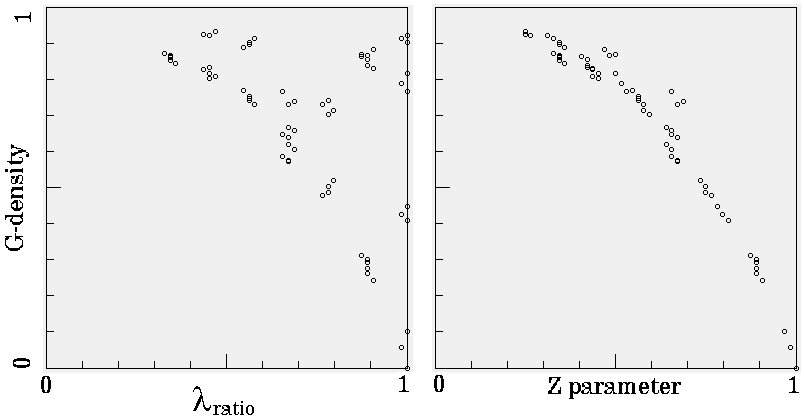
The density of garden-of-Eden states (G-density)
plotted against both lambdaratio
and Z for the
set of k=7 totalistic rules, n=16, for Z<=0.25. The
complete basin of attraction field was generated for each
rule and garden-of-Eden states counted.
G-density against against system size n
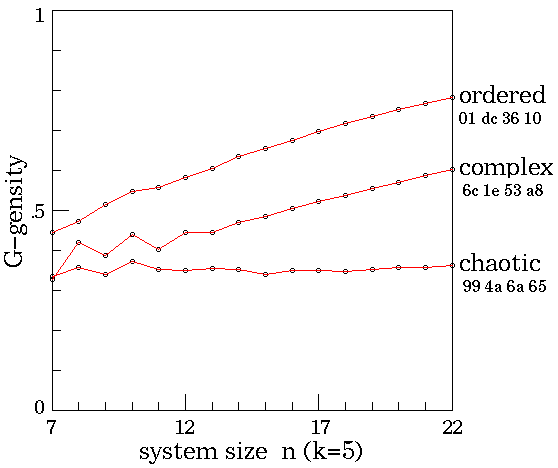
The G-density plotted against system size system size n,
for the ordered, complex and chaotic rules. The
the entire basin of attraction field was plotted for n = 7 to 22,
and garden-of-Eden states counted. The relative G-density
and rate of increase with n provides a simple measure of
convergence.
Ordered - Complex - Chaotic CA dynamics.
Typical sub-trees and their
in-degree histograms, shown in normal and log-log form.
Ordered CA dynamics.

Complex CA dynamics.

Chaotic CA dynamics.

Two random Boolian network basin of attraction fields
with a 1 bit difference in one rule.
The basin of attraction field a random map
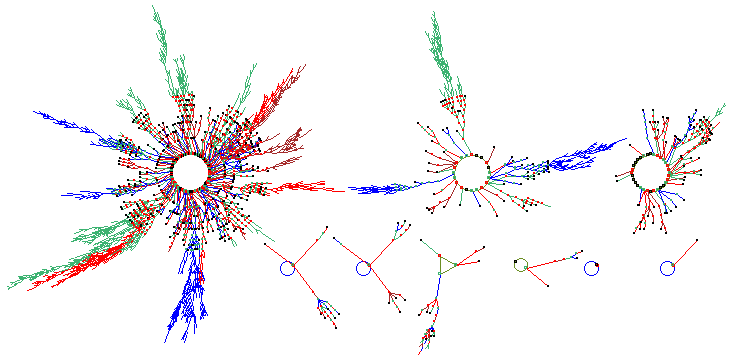
The basin of attraction field of a typical
unbiased random map.
n=12. The 212=4096 states
in state space are organized into 9 basins. The period (p) and
size (s) of the biggest three (top row), including their
percentage of state-space, are as follows: (1) p=118
s=3204=78.2%. (2) p=20 s=599=14.6%. (3) p=32
s=194=4.74%. The field's G-dencity=0.37 , implying
chaotic dynamics.
back to the start of Gallery
back to the
DDLab home page
Last modified: Oct 2008