 Discrete Dynamics Lab
Examples of the network graph and the attractor jump-graph
A new feature in DDLab is a graph with weighed vertices and
weighted directed
edges, which can be rearranged by dragging vertices. There are also
various other methods for investigating and manipulating the graph,
which can also be presented as a link table or matrix.
The graph is applied in two ways.
- To represent the RBN or CA network itself.
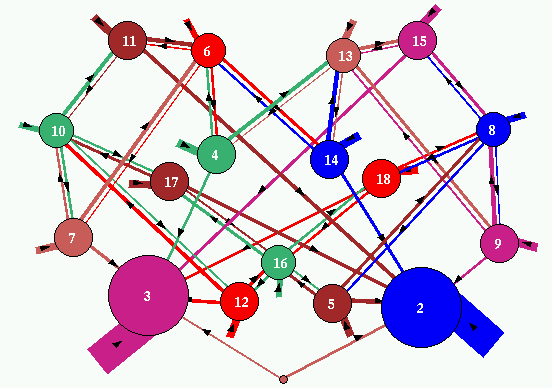
- As an attractor jump-graph, which shows the probability of
jumping between basins of attraction caused by 1-bit flips to
attractor states, giving an idea of the stability and mobility between
basins of attraction subject to noise.
The algorithm in DDLab version 23 contained an error in
computing the jump-graph, so please update to version 24 where the error
is fixed.
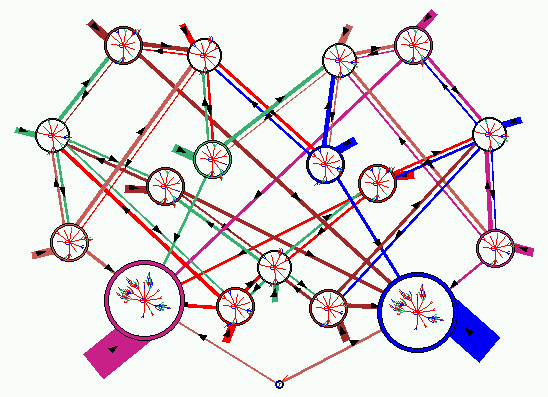
Both types of graph show nodes linked by directed edges,
where the outgoing edge is colored the same as its
parent node. Both the nodes and edges are scaled,
for networks graphs according to k, for attractor jump-graphs
according to basin volume,
the fraction of state-space in each basin.
The full width of the outgoing links is then apportioned according
to the jump probabilities.
The stubs on nodes indicate self links.
Click on each image to see it full size.

|
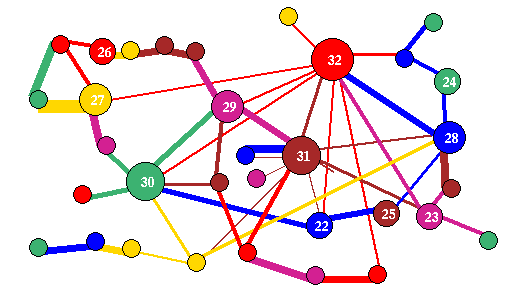
|
| The graph as it first appears.
| The same graph rearranged by dragging vertices with the mouse.
|
Fig 1. A graph of an RBN network, n=33 with a
power-law distribution
of both k and out-degree,
which is biased according to k. The power law exponent is 2.
Nodes and edges are scaled according to k.
|
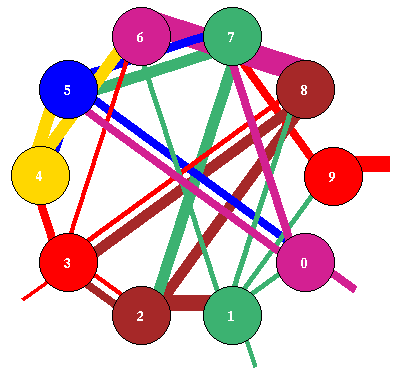
|
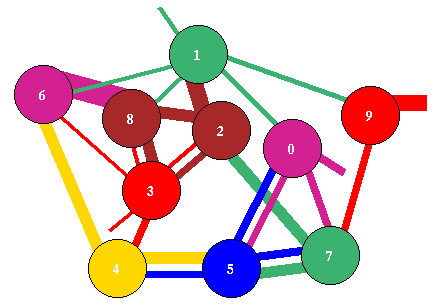
|
| The network graph as it first appears.
| The same network graph rearranged by dragging vertices with the mouse.
|
|
Fig 2. A graph of an RBN network, n=10, k=3.
Nodes and edges are scaled according to k.
Its attractor jump-graph is shown below.
|
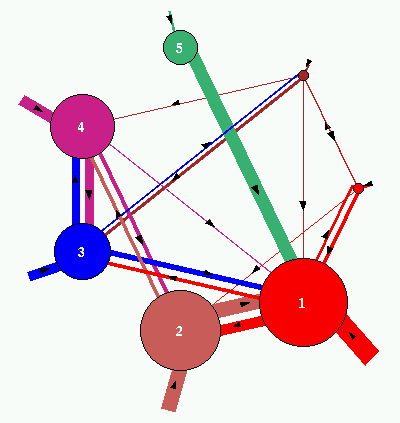
|
|
| The attractor jump-graph as it first appears.
| The same attractor jump-graph rearranged by dragging
vertices
with the mouse.
|
|
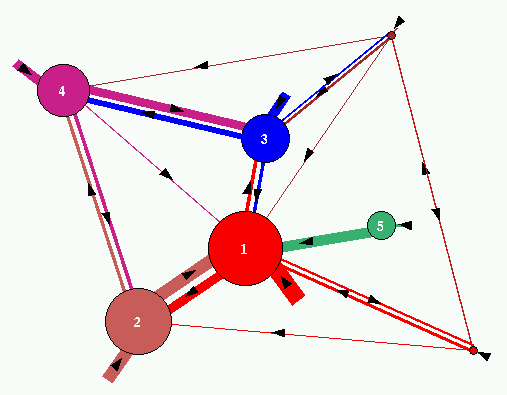
Fig 3. The attractor jump-graph of the network in fig.2.
There are 9 basins. Nodes and edges are scaled according to basin volume,
the fraction of state-space in each basin.
|
|
|
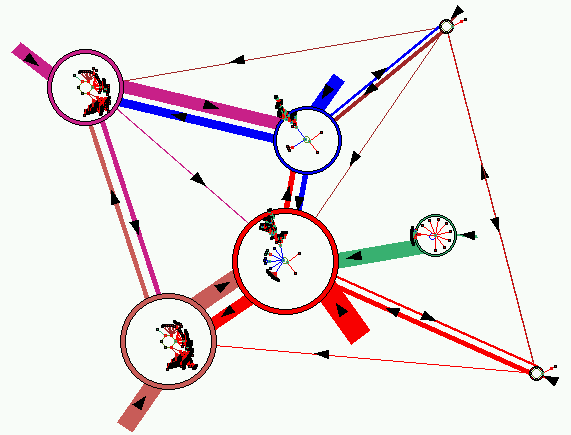
Fig 4. The attractor jump-graph with the relevant basins of attraction drawn
inside each node.
|
|
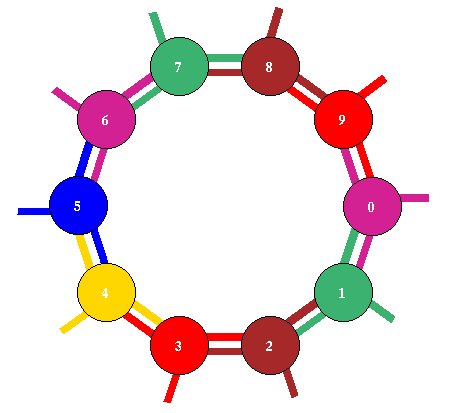
Fig 5. Above, the network graph of a 1d CA, n=10, rule 141.
The attractor jump-graph of the network is shown below.
|
|
|
| The attractor jump-graph as it first appears.
| The same attractor jump-graph rearanged by dragging
vertices with the mouse.
|
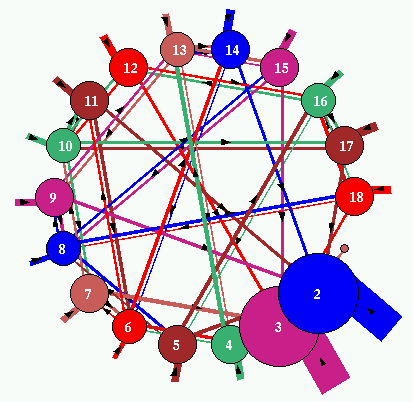
| Fig 6. The attractor jump-graph of the network in fig.5.
There are 18 basins. Nodes and edges are scaled according to
basin volume, the fraction of state-space in each basin.
|
|
| Fig 7. The jump-graph with the relevant basins of attraction drawn
inside each node.
|
back to the top
back to the DDLab Gallery
back to the
DDLab home page
Last modified: May 2002
|


