

Return maps for various networks. For a binary network, each state (bitstring) B1,B2,B3,...Bn is converted into a decimal number M (0-2) as follows, B1*1 + B2*(1/2) + B3*(1/4) + ... + Bn*(1/(2^n)). For a mutli-value network, each term is divided by v-1 for an equivalent result. As the network is itterated, Mt the value of the state at timestep t (x-axis) is plotted against Mt+1 the value of the state at timestep t+1 (y-axis). Note the fractal structure of the resulting trajectories and attractors.
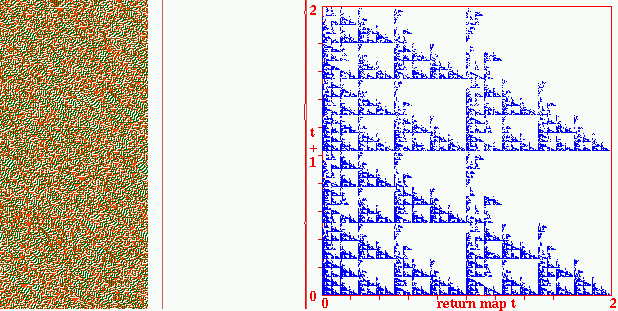
Fig 1a. A multi-value chain rule, k=3 v=3 CA rule (hex) 140842644a2669, n=150
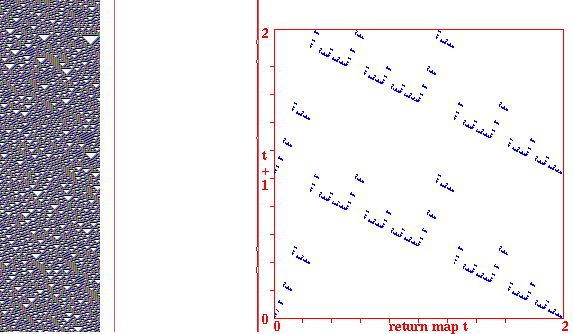
Fig 1. k=3 CA rule 30, n=100
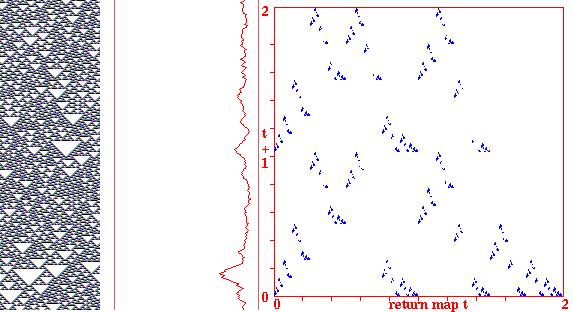
Fig 2. k=3 CA rule 22, n=100
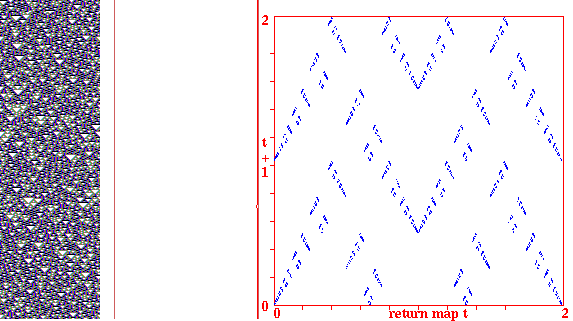
Fig 3. k=3 CA rule 90, n=100
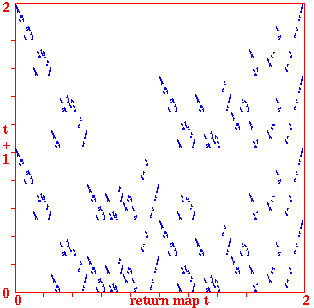
Fig 4. k=5 CA n=100
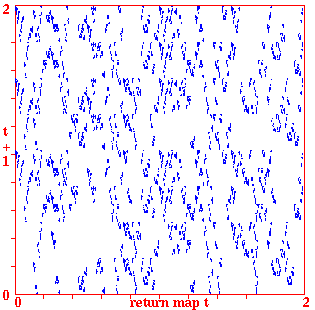
Fig 5. k=7 CA n=100
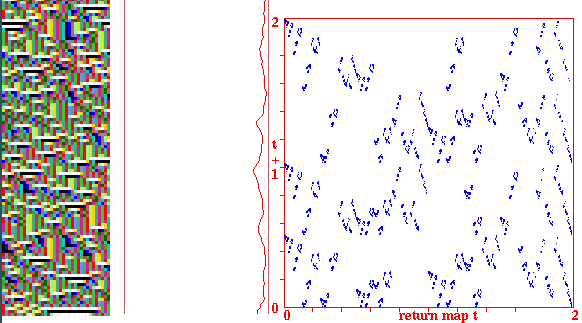
Fig 6. k=5 random wiring, one rule 56d8902b, n=30.
The graph shows the "input-entropy" for a moving window of
10 time-steps.
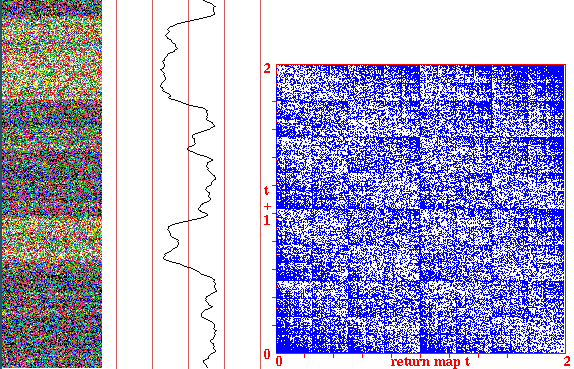
Fig 7. k=5 random wiring, one rule, totalistic 011001, n=100.
The graph shows the density of 1s in a moving window of
10 time-steps. This is an interesting rule because of the
unpredictable bi-stability.
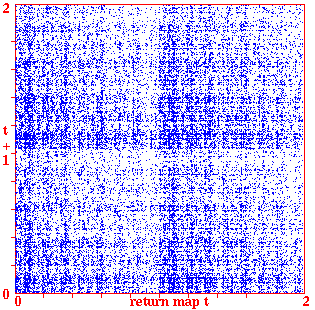
Fig 7. k=5 RBN n=100
back to the start of Gallery
back to the
DDLab home page
Last modified: Jan 2003