This teach file introduces some ideas related to the development of dynamical systems, and especially those that show chaotic behaviour. The associated idea of a fractal dimensions is introduced.
Classical mechanics deals with how deterministic systems, such as swinging pendulums and orbiting planets, change with time. The dynamics of such a system are described by its state, which captures the values of all the variables that are needed to predict the future of the system, and a set of rules, often in the form of differential equations, which say how the state changes with time. For example, the state of a simple (undriven) pendulum is given by its angle to the vertical and the speed with which it is swinging. The rules that govern the pendulum are a pair of differential equations that involve only these two variables. (Parameters such as the length of the pendulum are not part of the state, because they are constant; such parameters are thought of as part of the rules.) The differential equations are solved, with the current state as an initial condition, to predict or simulate the evolution of the system. This is done analytically in very simple cases, but more often numerically (see FCS6).
(Quantum mechanics, by contrast, describes systems that are fundamentally non-deterministic, and have unavoidable randomness. Real physical systems appear to have this quality, though on a large scale they are well described by deterministic laws. In quantum mechanics, the probabilities of the system's being in various states evolve according to deterministic rules, but the future state itself cannot be predicted exactly. A third approach, statistical mechanics, is used to describe systems that are supposed to be fundamentally deterministic, but where probabilities are used to represent our ignorance of the microscopic details of the system.)
Two things might seem to be sufficient for the study of a deterministic system: (1) discovering the rules governing it; and (2) finding sufficiently accurate analytic or numerical techniques to use these rules to predict its evolution. Indeed, this is true for many practical purposes. However, understanding a dynamical system involves more than this, and we often want to characterise and classify systems rather than to treat each in isolation, in order to gain some insight into their structure. There are many ways to approach this, but here we concentrate on one or two of the more graphical ones, which have come to increased prominence recently, although their roots were established many years ago.
Simple physical systems often provide analogies for the study of living or artificially living systems. One important class of behaviour that is increasingly identified in physical systems is chaotic behaviour, which is of particular interest because simple deterministic rules produce high degrees of complexity and unpredictability in the system itself. Chaos can readily be demonstrated with simple simulations, but may play in important role in understanding the evolution of complex simulations with large numbers of parameters and variables.
Central to the idea of chaos is that tiny fluctuations in the current state of a system produce large changes in its future state. To describe this property, it is necessary to look at smaller and smaller variations in the state. This idea of moving to every smaller scales and ever greater detail leads to the use of fractal descriptions of the state trajectories associated with this kind of dynamics.
A good introduction to chaotic dynamics can be found in "Chaotic Dynamics: an introduction" by G.L. Baker & J.P. Gollub (Cambridge U.P., 1990, in library at QE 5360 Bak). There are many books on fractals, which because of the application to computer graphics are often very attractively illustrated; a good example is "The Science of Fractal Images" edited by H.-O. Peitgen & D. Saupe (Springer-Verlag, 1988, in library at QD 2500 Sci). Also possibly of interest is "Complexity : life at the edge of chaos", by R. Lewin (Dent, 1993, in library at Q 1200 Lew) - and see also the various books in the library catalogue with "chaos" and "fractal" in their titles.
A central concept in dynamical systems is that of state. The idea is that the state of a system is known, then no further information will be any help in making predictions about the system. Specifying the state separates the future from the past, in that everything in the system's history is irrelevant to predicting the future provided the state is known.
One way of thinking of this in relation to simulations is to imagine a procedure which is called whenever the simulated time is to be advanced by one tick of the clock. If the procedure has no local memory in which it can store variable information between calls to it, the arguments it is given and the results it returns will necessarily represent the state of the system.
A physical example is given by the solar system. The laws of gravity provide the rules which govern the motion, which together with the masses of the Sun and planets provide the fixed information. The state is given by the positions and velocities of the heavenly bodies in some suitable frame of reference. If these are known, then there is no point in knowing where Jupiter was last week, or what its current acceleration is; such extra information is simply redundant.
Similarly, in a genetic program, the state at a point between generations might be fully represented by the genomes of all the current individuals. Extra information, such as their previous levels of performance on some task, or their ancestry, could be irrelevant to what will follow, in that the algorithm progresses with no information other than the genetic sequences.
The state will usually be a collection of the values of some variables. It seems reasonable to put this collection into a single structure, and this is then known as a state vector (see FCS4 and FCS5). Given that, it is a small step to decide to see whether the geometrical interpretation of the vector is any use, and to start thinking of it as representing position in an abstract state space or phase space.
Note, however, that these vectors do not represent simple physical entities, and their components have varying interpretations. For example, if a system consisting of a single object moving in 3-D is being analysed, its state vector might well need 6 components, 3 for position and 3 for the components of velocity. Phase space for this object will be 6-dimensional. If the object also had a direction it was facing different from its direction of motion, then a further 2 components might be needed to represent its orientation in space. As with any high dimensional representation, the value as a conceptual tool depends in part on whether there is a sensible way to look at it in 2 or 3 dimensions in order to produce pictures.
An example of the use of phase space is provided by a simple pendulum. The point of using such a simple system is that its phase space is already low-dimensional, so it is easy to produce graphical representations.
The state of the pendulum is given by two variables. The first is its angle to the vertical, theta, which will be positive when it is to the right of centre and negative when it is to the left, say. The second is the rate of change of this angle, or the angular speed, omega. The state might be written as (theta, omega), and phase space is a 2-D plane with theta and omega as the axes.
If the amount of swing is small, the rule governing the state is given by a matrix relation (FCS3):
    -               -         -              - -       -
    | d theta / d t |    =    |   0      1   | | theta |
    | d omega / d t |         |  -1    -1/q  | | omega |
    -               -         -              - -       -
To simplify the equation, I have assumed that the pendulum has a certain period (actually 2*pi or about 6.283 in whatever time units are being used). The parameter q is a number which describes how much damping (such as air resistance) there is: large q means little damping. The variable t stands for time.
The vector on the left is a vector of rates of change of the state variables. If the state vector is thought of as the position of a point, then the vector on the left is simply the velocity of that point. If this is not obvious, try replacing theta and omega by x and y, and remember that velocity components are just time derivatives of position components. The vector on the left gives the direction and speed of motion of the state vector through phase space.
Suppose q is very large, so the bottom right-hand element of the matrix is almost zero. Then the matrix is just a rotation matrix through -90o (see FCS4, section 4.2), since cos(-90o) = 0 and sin(-90o) = -1. That means that wherever the state is in phase space, its motion will be at right angles to the line joining it to the origin. In other words, the state will go round in a circle. (See also the discussion of flow fields in FCS5.) The trajectories of the system in phase space are circles around the origin. This set of circles characterises the behaviour of the pendulum - and of course, the cyclical nature of the circle represents the oscillation of the undamped pendulum. The circles are known as limit cycles.
If q is made smaller, so that there is some damping, then d omega / d t will have an extra contribution of -omega/q. This allways acts to pull the point inwards towards the theta axis. (Plot a few of the vectors corresponding to this contribution if this is not clear.) This means that the state will spiral inwards towards the origin, wherever it starts from. This corresponds to the running down of a free pendulum which is damped by air resistance. Since all trajectories end up at the origin (which is the state of no motion and a vertical pendulum), the origin is called an attractor of the system.
In fact, the idea of an attractor is generalised to include limit cycles and other structures in phase space that characterise the long term behaviour of a system.
You may have met the elementary analysis of the simple pendulum, in which the differential equations are solved to get an explicit equation for theta as a function of t. The graphical way of looking at it using phase space provides a much more powerful and general technique for studying dynamical systems.
On a practical note: the matrix equation can be used in writing a simulation of the pendulum. At each time step, the derivative d theta / d t is multiplied by the size of the time step in order to compute the amount by which to change theta (see FCS6). Likewise for omega. Baker & Gollub's book (see above) uses Runge-Kutta integration to get the numbers, but Euler integration with a small time step works well, and will replicate the behaviour demonstrated in Baker & Gollub's examples. It is not difficult to write a program which will display both the pendulum's motion and the phase space trajectories - see below for details of one such program to display trajectories.
It is worth noting that trajectories in phase space cannot cross one another. The reason is simple: at the crossing point, you would need to know which trajectory you were on in order to know in which direction to continue. But the position of the point by itself is sufficient, by the definition of 'state', to know which way to go next - knowing which of two trajectories was being followed is bound to be superfluous. So two trajectories cannot pass through the same point and continue on the other side, though they can converge on an attractor.
A second property is that for systems that do not lose energy, such as the pendulum with very large (infinite really) q, area is conserved in phase space. What this means is that if you take a bunch of states that cover a region of phase space, and let them all evolve for a while, then they will be covering a new region of phase space, but with the same total area. This obviously happens for trajectories that move round concentric circles. If the system loses energy, as when the pendulum is damped, then the area covered reduces with time - the points get squeezed together as they approach the attractor.
In general, the advantage of a phase space description is that it allows a qualitative description of the system, in terms of the main features of the trajectories rather than in terms of arrays of numbers. In addition to point attractors and limit cycles, phase spaces are characterised by features such as critical points which are unstable points, where trajectories diverge, or saddle points where trajectories converge along one direction and diverge along an orthogonal direction. Areas round attractors are described by basins of attraction: any trajectory starting in the basin of attraction round an attractor will finish up at the attractor, like water in the catchment area of a reservoir.
A practical use of phase diagrams is in research in biomechanics, where they are used in the analysis of human motion. For example the angle at a person's elbow might be plotted against the rate of change of that angle during a reaching task, in order to make disorders of motor control graphically apparent. Phase descriptions of the cardiac cycle are important in trying to understand how certain failures of cardiac rhythm arise.
The simple pendulum served to introduce the idea of phase space, but it did not illustrate the idea of chaos. To do this, two modifications are needed. The first is that the system is made nonlinear - that is, that the velocity of the state vector is not just a matrix multiplication of the state vector itself. For the pendulum, this can be achieved by using the more physically realistic equation that is needed to describe a pendulum with a larger amplitude of swing. The equation is
    -               -         -              - -            -
    | d theta / d t |    =    |   0      1   | | sin(theta) |
    | d omega / d t |         |  -1    -1/q  | |   omega    |
    -               -         -              - -            -
where the only change is the nonlinear function sin applied to theta before the matrix multiplication is done.
The second change is that the pendulum needs to be sustained by a periodic force which operates at a different frequency from the pendulum's natural frequency. Such a force must be applied by some external mechanism, and will be taken as an angular force on the pendulum which varies sinusoidally. The current value of this force is another state variable, which will be called phi, so the state vector has three elements. The equations with the driving force are
    -               -         -                  - -            -
    | d theta / d t |    =    |   0      1     0 | | sin(theta) |
    | d omega / d t |         |  -1    -1/q    g | |   omega    |
    -               -         -                  - |  cos(phi)  |
                                                   -            -
d phi / d t = k
where g and k are two new parameters. The last equation just means that phi increases steadily, which means that cos(phi) oscillates. The effect of the force is to add a term g * cos(phi) to the omega component of the state velocity, so that this vector will wobble in phase space as time progresses.
Since phi changes steadily in an uninteresting way, the usual way to view the trajectories is to plot omega against theta as before, but to bear in mind that this is only a projection of the real 3-D trajectory, which winds outwards from the theta-omega plane along the phi axis. If the 3-D trajectory is imagined as a wire winding across a room, it is as if the shadow of the wire was projected onto one wall by a distant light source. Although the trajectory cannot intersect itself, its projection can.
The details of these particular equations are not important. For particular values of q, g and k, this wobble has extreme consequences for the trajectories, and what is important is to see the level of complexity that is needed in the equations to allow a qualitative change in the behaviour.
The nature of the change is that the trajectories are no longer confined to tidy paths in phase space, but wander across it. The new equations produce a radically different picture when these trajectories are plotted. This occurs, for example, for q = 2, g = 1.5 and k = 2/3. An example program that will plot these trajectories is described below, or they can be found in books on chaotic dynamics.
A program which carries out Euler integration of the equation above is described in section 3.3.
It is quite hard to interpret a diagram consisting of chaotic trajectories that wander across phase space or a projection of it. One way of simplifying the picture is to make use of the fact that the driving force is periodic: from any starting point, it returns exactly to what it was after a time interval of 2*pi/k. If the trajectories are going to have any regularity, this is bound to show up if we look at the state of the system each time the driving force returns to any particular point in its cycle. If the system is behaving simply, then the (theta, omega) point will occupy one of a small selection of locations in phase space at this stage of the cycle, whereas if the system is chaotic, then the point might be found in a much larger number of locations.
This is the idea of the Poincare section. Instead of plotting a more or less continuous succession of theta and omega values, we choose an arbitrary state of the driving force, and then plot theta and omega only at times when this state is reached. This can give a clearer picture of what is happening in phase space, and allows the structure of attractors to be seen more clearly. This is like superimposing a set of slices through the trajectory, all perpendicular to the phi axis and spread out along it. Another way of thinking of it is that it is like taking snapshots of the pendulum's state using stroboscopic lighting triggered by the driving force.
It is easier to understand this material by looking at pictures than by reading words. Examples can be found in books, but there is also a program which can be run if you are reading the teach file version of this document from Ved at a graphics terminal.
Although not a substitute for the interactive version, two examples of the results are shown here. First, for q = 2, k = 2/3 and g = 1, the state trajectory is displayed as
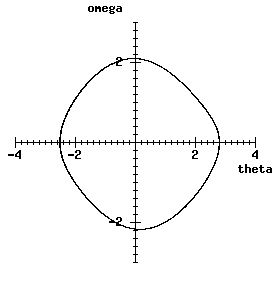
The Poincare section with these parameters is just a dot, somewhere on the trajectory shown above.
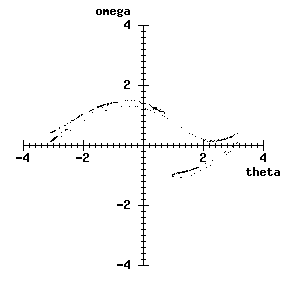
If, however, g is set to 1.5, the trajectory looks like
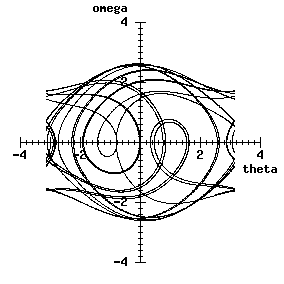
whilst the Poincare section is diffuse:
You could set up a similar demonstration fairly easily using a package such as Matlab.
One of the most important characteristics of chaotic system is that small changes in initial conditions produce, over time, rapidly diverging trajectories in phase space. A block of neighbouring starting points in phase space will be smeared out across a wide region as time progresses.
A physical system which demonstrates such behaviour more obviously than the pendulum consists of a set of static billiard balls on a table, into which one ball is fired. If friction is somehow made very low, there may be many collisions. Now if a small change is made to the initial direction of motion of the moving ball, a much larger change will result its direction of motion after the first collision. The reason for this is that the initial angular change gets converted into a change in the point of collision between the two balls, and the point of collision affects the outward direction strongly. After only a few collisions, a microscopic change in the initial direction will produce a radically different configuration of the balls. In fact, a real billiard table is not chaotic because there is friction but no input of energy, and the trajectories end up on an attractor corresponding to stasis, but it could be made so by some means of adding energy to the system to keep the balls in motion, perhaps by vibrating the edges of the table.
Similar arguments are often applied to large-scale physical systems, with the atmosphere providing one of the chief examples: it seems likely that the weather is actually chaotic, and so a tiny perturbation in one part of the world will produce large changes elsewhere subsequently.
This unpredictability fits in with the diffuse nature of the Poincare section in these cases: at a fixed point in the driving cycle, the pendulum might be at all kinds of different states, and short of running the full simulation, there is no way of computing the state an arbitrary time into the future.
The pendulum simulation involved 3 parameters: the amount of damping, the strength of the driving force, and the frequency of the driving force. These parameters have to be given numerical values for a given simulation. Some combinations of values produce chaotic behaviour and some do not. One way to explore this division of the parameter space is to fix two of them and vary the third. If q and k are kept fixed, at say 2 and 2/3 respectively, then the behaviour shows an interesting variation with g. As g is increased through a range from say 0.5 to 1.5, the behaviour changes several times from non-chaotic to chaotic. The transition into chaos is not abrupt, however; at g = 1.5 there is chaos, but at g = 1.49, say, the trajectories are orderly but complex. In fact, as g is increased through the range just below 1.5, the trajectories display a phenomenon called period doubling, in which the trajectory of the pendulum in phase space requires 2, then 4, then 8 (and so on) cycles of the pendulum before it repeats itself. This can be displayed using bifurcation diagrams, which will be found in textbooks, and can be observed using the simulation mentioned above. The transition into chaos - the "edge of chaos" - is regarded as highly important in some theories of self-organising systems (see the book by Lewin mentioned above).
This introduction has been in terms of a simulation of a simple physical system with continuous values for its state variables. Many other kinds of system exhibit chaos, however, and these include systems whose state space is discrete rather than continuous. Cellular automata are examples of such systems. An interesting example of a chaotic cellular automaton is given in the paper 'Evolutionary games and spatial chaos', by M. A. Nowak & R. M. May (Nature, 359, 826-829, October 1992). Here, agents on a 2-D grid interact with each other, playing a game called 'Prisoner's Dilemma', and adjusting their behaviour to copy that of their most successful neighbour. Remarkable chaotic graphic patterns ensue. If you are reading this from Ved, you can run this system from the file TEACH * PD_GAME. (You don't need to know Pop-11 for this - just mark and load the examples in the file.) Although this is superficially a completely different system to the pendulum, there is again an adjustable parameter which causes transitions between chaotic and non-chaotic behaviour.
The Poincare section for a chaotic system looks characteristically smeared out across the projection of phase space. Is it possible to make a more quantitative measurement that reveals the nature of this structure? There are various ways of doing this (including using the entropy - see FCS7), but one particularly interesting mathematical tool is the idea of fractal dimension. This idea will be briefly outlined here; there are now many textbooks dealing with the topic, and these are often worth looking at because of their excellent graphical presentation of the material.
The idea that a room has 3 dimensions, a sheet of paper 2 dimensions, and a line on it 1 dimension may already be familiar. Of course, the paper and the line are idealised: we pretend they have no thickness or width. The number of dimensions corresponds to the numer of coordinates that are needed to represent a position within the structure. In addition to these everyday examples, space-time is a 4-dimensional structure, whilst a point has 0 dimensions. In all these cases, the dimension is a whole number.
In fact, it is possible to give a fractional dimension a well-defined meaning. Some structures can sensibly be regarded as having 1.5 dimensions, for instance (and it turns out that the set of points in a Poincare sections is sometimes one of this type). Such a structure must be somehow more than a line, and less than a plane. One way to generate an object like this is to draw a straight line, then replace its middle third with two sides of an equilateral triangle, then to repeat this operation on each of the lines we now have, and to keep doing this indefinitely, with the lines getting shorter and shorter. (This is called the von Koch curve.) The structure is more than a line in the sense that there is a 2-D region of the plane where every point is less than some infinitessimal distance from it, but less than a plane in that every point that is part of it has a neighbouring point that is not. The structure is something like a sponge, occupying a part of some space but not filling it solidly.
The most significant aspect of a fractal is that it has structure on all scales. That is, if you look at it under a magnifying glass you will observe the same sort of detail that you could see with the naked eye; if the magnifying glass is replaced with a microscope, the appearance will still be roughly similar; and so on, however powerful the microscope is made. This property is known as self similarity. The von Koch curve was designed to have a particularly simple form of self similarity, but fractal structures in general exhibit it.
Apparently bizarre structures like this are not only relevant to describing chaotic systems. They appear to be useful models of a variety of natural systems. The classic example is the coastline of Britain, which on a large scale shows headlands and estuaries, on a smaller scale shows small inlets and rocky points, and so on down to the interstices between grains of sand. Recently, much has been made of fractal systems as representations of the structure of images of natural scenes, and the application of this to image encoding and compression.
A fractal is mainly characterised by its fractal dimension. This is measured by exploiting the self-similarity, and asking how the object appears to change as the scale of observation is adjusted. We start by looking at a different way of defining the dimensionality of non-fractal objects.
Take an ordinary 2-D shape and draw a grid over it. Let the size of one side of each box be L, and count the number of boxes lying over or partly over the shape. Call the number of boxes N0. The ordinary area of the shape is roughly the number of boxes times the area of each one, or
                2
    A  =  N0 * L
so the initial number of boxes is given by
                    2
    N0  =  A * (1/L)
Now make the boxes r times smaller. That is, make the side of each box equal to L/r, by drawing extra lines between the original grid lines. The area of each box is now (L/r)^2, so the new value of N, which I write as a function of r, is
                      2
    N(r)  =  A * (r/L)
                      2     2
          =  A * (1/L)  *  r
                   2
          =  N0 * r
This won't be exact, as the curved edges of the shape will pass through the middle of some boxes at each scale, but as long as the original boxes are small enough that the estimate of A is reasonable, it will be a good approximation. And as the original boxes are made smaller and smaller, the approximation will be more and more accurate.
The quantity A * (1/L)^2 is a constant, N0, so what we have is that the number of boxes needed to cover the shape is proportional to r^2 in the 2-D case, where r is the scaling factor for the boxes.
Now consider a 1-D line. Let A stand for the length of the line. Split the line up into segments of size L and count the number needed to cover the line. The number of segments is N0 = A/L. Then divide each segment into r parts and count again. The number needed is just
N(r) = N0 * r
i.e. in 1-D the number is proportional to the scaling factor.
Do the same thing in 3-D: split an object occupying some 3-D volume up into cubes, with L being the side of each cube. A is now the volume of the object. Then you get
                    3
    N(r)  =  N0 *  r
In each of these everyday cases, the power that r is raised to is the dimensionality of the object. Note that if you have, say, a 2-D surface embedded in a 3-D space, and you look at how many boxes you need to contain it, you still get the power of 2: it's the dimensionality of the object, not the dimensionality of the space it lives in, that is measured.
Now do the same for a fractal patterns. You start off as before with
                  2
    N0 = A * (1/L)
as the number of boxes covering it. You only need to count boxes that actually have black dots in them. Now, A is a sort of "effective area" at the scale defined by the length L - it's more or less the area that would get covered if the dots, rather than being infinitessimal points, were dots of a size comparable with L. (They'd overlap of course.)
Then you make L smaller by dividing by r, as before. What happens then, though, is that you don't need as many boxes as you expect, because as the boxes get smaller, more of them fit into the white spaces between the dots. What happens is that instead of getting N = N0 * r^2, you find that you get N = N0 * r^D, where D is a number less than 2. But however small you make the boxes, you never get down to D = 1 as you would with a smooth curve - D flattens off at some definite intermediate value.
The number D is the fractal dimension of the object. For the von Koch curve it's actually about 1.26. The curve has the fractal dimension because however closely you look at it, there is always more structure to see, so the effective area gets smaller and smaller as you reduce the scale. However, the effective area never gets down to zero as it would for an ordinary curve (which has a fractal dimension of 1).
One way of generating fractal structures, exploited particularly in image processing, is the iterated function system (IFS) technique, associated particularly with M.F. Barnsley (see the book edited by Peitgen & Saupe mentioned in the introduction). This is of interest here as a second example of a dynamic system which can generate fractals, although this time the process is more direct in that simulation of a physical system is not involved; phase space is more or less manipulated directly.
In an IFS, a vector (here 2-D) is manipulated using matrix multiplication and addition. Consider a point (x, y) subjected to a matrix multiplication and a vector addition. The new point, (x', y') is given by
    -    -        -       - -   -       -   -
    | x' |   =    | a  b  | | x |   +   | e |
    | y' |        | c  d  | | y |       | f |
    -    -        -       - -   -       -   -
where a, b, c, d, e and f are 6 parameters of the transformation. If this is done repeatedly, replacing (x, y) by (x', y') at each stage, and the successive positions are plotted, the dots will form a trajectory in the plane. If the elements of the matrix satisfy a certain condition (it defines a contractive mapping), the trajectory will converge to an attractor.
In an IFS, a set of transformations like this is first defined, each with its own set of 6 parameters. There are typically a small handful of transformations in an IFS. Then at each iteration of the algorithm, one of the transformations is selected at random (using predefined probabilities) and applied to the point. The next iteration will again select a transformation at random, either the same one or a different one. The result is that the point defined by (x, y) follows a complex random walk around the plane, being continuously pulled to different attractors. The result is not, however, a superimposition of simple shapes, but (in general) a fractal pattern, showing self similarity.
Examples abound in books: the most standard is a fern leaf, generated by four transformations with the parameters
         a       b       c       d       e       f      Probability
       0.85    0.04   -0.04    0.85      0     0.3       0.85
      -0.15    0.28    0.26    0.24      0     0.0825    0.07
       0.2    -0.26    0.23    0.22      0     0.3       0.07
       0       0       0       0.16      0     0         0.01
(the probabilities are not critical). The result is shown below. It is straightforward to write a program that generates the image of the pattern from these parameters. It is not difficult to come up with sets of parameters that generate other patterns.
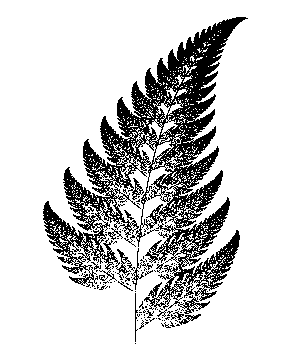
Part of the interest in these systems is that an object that looks immensely complex if taken piecemeal is shown to be summarised by a rule that has only a small number of numerical parameters. This has both practical application to areas like image compression, and theoretical value in understanding complex dynamic systems.
The IFS brings together nicely the idea of a dynamic system described by a phase space trajectory, and the fractal dimension. However, many other rules can be used to produce fractal objects: two examples are the logistic map, used in studies of population dynamics, and the L-system which operates in the domain of formal languages and their grammars.
This teach file differs from the preceding ones in that no new mathematics is involved. Differential equations, matrices, vectors and probability have all been encountered already. However, their application to chaotic dynamical systems opens up a rapidly developing area, which has major applications to the understanding of complex systems. Understanding systems with many interactions will involve a vast variety of techniques, from transparent simulations to extremely abstract formal mathematics. You will need to use imagination to find the level of analysis that is appropriate for your problem and your way of looking at it.
Copyright University of Sussex 1997. All rights reserved.