Business
as Unusual
An Explanation of
the Increase of Private Economic Activity in High-Conflict Areas
in
Afghanistan
Data Web Appendix
Tommaso
Ciarli,
Chiara Kofol, Carlo Menon
This version: Sunday 24th
May, 2015
|
Paper
abstract
We explore the relation between the change
in conflict intensity and the investment in
private economic activity (PEA) of nearby households in
Afghanistan,
exploiting a unique dataset containing
geographically detailed information on conflict events and on
households' activity. We identify the effect of
several indicators of conflict on a range
of different types of PEA, differentiating across levels of
formality,
sectors, and capital intensity. The
results show that the level of conflict, its impact, and to a
lesser extent its frequency, increase the probability
that a household engages in self
employment activities with lower capital intensity and in
activities
related to subsistence agriculture.
However, the magnitude of most effects are quite small. |
Introduction
This appendix describes the data used in the paper Ciarli Tommaso,
Kofol Chiara, Menon Carlo, 2015, "Business as unusual. An explanation
of
the increase of private economic activity in high-conflict areas in
Afghanistan", Working Paper, mimeo. The web appendix is divided into
two
main sections, respectively discussing the harmonisation of household
data and the construction of the conflict
data.
Household
Data: National Risk and Vulnerability Assessment
(NRVA)
1.1
Household Surveys and Sampling
NRVA covers a
large number of households (11,760 households in 2003, 30,826 in 2005,
20,668 in 2007/2008 ) over the whole of Afghanistan, from 2003 to 2008
(in three waves). Data were stratified into different agro-ecological
zones. Household were randomly selected within wealth groups. Whenever
possible seven households were surveyed within each randomly selected
village. However, there are large differences among the different
waves, both in terms of sampling and questionnaire that needed to be
harmonised. Here we describe the sampling strategies for the different
surveys.
In Section 1.2.2
we briefly describe the
harmonisation procedure.
NRVA
2003
This wave of
data differs from the 2005 and 2007/2008 ones both in the structure of
the survey and in the sampling design. The sample frame, which relied
on a village list from the World Food Programme (WFP), is not
available. Given the aim of the survey, the data collection is probably
biased towards larger rural settlements. The four levels of data
collection are: district, community (shura), wealth group, and
household. On top of the households interviews data was collected as
well at the community and district level. Female interviewers (which
collect food consumption data, which is not relevant in our analysis)
were not always involved in the south, most eastern districts and urban
areas -- only rural areas and Kuchi (nomadic) population were
interviewed by females.
The
survey took place during 3 months, covering only one season, all 32
provinces (at the time), all 368 districts (at the time), 1853
villages, 5559 wealth groups, 11757 rural households, and 85577
individuals. Stakeholder participated in questionnaire design only
partially. Among others, the Ministry of Labor and Social Affairs, the
Ministry of Economics and the Afghan Central Statistical Office (CSO).
The
questionnaire has a unique format, some data were entered manually
while other data were transcribed into Teleform format (software that
extracts data from paper questionnaires) and scanned. Several trainers
were involved in training the enumerators, which may result in
variation in the enumerator performance.
The
survey collects information on basic demographics, health, housing,
household assets, migration, labour, risk exposure and response,
livestock ownership, agricultural activities and household food
consumption. For the definition of PEA we use the labour section. The
questionnaire is no more available at the CSO, but can be made
available by the authors on request.
NRVA
2005
The
sample frame was made
available from CSO
pre-census household listing. The sampling is proportional to
population, except in the smaller provinces and urban centres where
over-sampling insured enumeration of sufficient number of households.
The sample selection is based on a random selection from geographically
ordered Primary Sample Units (PSUs), to give a random spread
representing the spatial distribution of the population. The household
selection was based on the random start method in the randomly selected
villages, where twelve households were interviewed.
The data
was collected at three different levels:
district, community, and household. Female interviews took place in all
provinces except Zabul. The survey covers both rural and urban areas as
well as the Kuchi population.
As for
2003, the survey took place during 3 months
(June-August), covering only one season, during or immediately after
the harvest. As this is a time of the year where high consumption
patterns are expected, the data mat produce seasonally biased results
and poverty estimates that are low compared to the annual average and
several other months. We do not use these sections in this paper. The
survey covers all 34 provinces, all 392 districts, 2597 clusters, 30822
households, and 221586 individuals. All stakeholders participated fully
in the questionnaire design: the Afghan Government (CSO-MRRD), the
European Commission (EC/NSS) (main donor), the World Food Programme
(WFP), and the United Nations Children's Fund (UNICEF).
The
survey includes more information than in 2003,
including sections on remittances, HIV/AIDS, maternal and child health,
household non-food consumption and income sources --
questionnaires available here.
The questionnaires were Teleform (software that extracts data from
paper questionnaires) scannable with data quality routines built-in.
The enumerators received uniform training by 2 trainers involved for
the whole country. More than 500 field staff were part-time employed.
The survey was managed by Government (CSO-MRRD) and funded by EC/NSS
(main donor), WFP, UNICEF.
NRVA 2007/8
This wave
is in many ways similar to the NRVA 2005,
explicitly with the intention to allow for comparisons. Similarly to
2005, a process of stakeholders consultation provided inputs to further
improve the survey and the questionnaire design. In order to facilitate
the stakeholder consultation, two workshops were held in January and
March 2007. The draft questionnaires were tested twice in the field and
a pilot test of the questionnaires took place in five regions for
further and final improvements. The questionnaire format was designed
in Teleform (software that extracts data from paper questionnaires) to
allow for data scanning. Around 1.6 million questionnaire pages were
completed and scanned.
The
fieldwork started in mid-August 2007 and lasted
up to the end of August 2008. Differently from 2003 and 2005 NRVA the
seasonality bias was removed conducting the survey during all 12
months.
The sample
frame came from
updated CSO pre-census
household listing. The sample is proportional to population, with
over-sampling of smaller provinces and urban centres. The sample
selection is based on random start method to have a better geographic
distribution of the sample. Households within selected villages were
randomly selected from CSO household listing. Eight households in each
village were surveyed.
The data
was collected at
three levels: district,
community (shura), and household. Female interviewers participated in
all provinces except for Urozgan (good female coverage). The survey
covers both rural and urban areas and the Kuchi (nomadic) population.
The survey
covers all 34
provinces, 395 districts,
2572 clusters, 20576 households, and 152262 individuals. The
stakeholders fully participated in the questionnaire design: the
CSO-MRRD, the EC/NSS, the WFP, the Department for International
Development (DFID), the Asian Development Bank (ADB), UNICEF, an the
World Bank (WB).
With
respect to 20003 and
2005 a few more section
were added: disabilities, labour market participation (available in
2003), infant- and under-five years old mortality, and women's
position. The 2007/8 survey includes also more details on household
food and non-food consumption and dropped the section on HIV/AIDS --
questionnaires available here.
The enumerators received uniform training in one training session for
all field staff for the whole country and was more detailed and longer
(17 days) training than in previous years. 156 field staff were
selected. The method of staff selection was more transparent (short
listing, test and interview from 12 thousand applicants). The survey
was managed by the Afghan Government (CSO-MRRD) and funded by EC/NSS
(main donor), WFP, the Department for International Development
(DFID),
the Asian Development Bank (ADB), UNICEF, an the World Bank (WB).
1.2
Households Data Harmonisation and Construction
As described in Section 1.1
the methodologies used for data collection, as well as the
questionnaires were different across waves. The harmonisation is easier
for 2005 and 2007/8, which use the same sampling, and which use a more
similar questionnaire. The comparison with 2003 is more complicated,
particularly because of the different sampling, and is used in this
paper as a robustness check providing a longer time variation.
Below we
briefly describe the harmonisation procedure
that we have followed, starting with the main control variables (1.2.1),
to
then focus at more length on the the dependent variable computing the
different sources of PEA (1.2.2).
In
the last two parts we summarise how we harmonised the differences
that were introduced in the Afghan sub-national administrative
boundaries (Provinces and Districts) (1.2.3)
and how we geolocalised the villages (and their households) (1.2.4).
1.2.1
Control Variables
For 2003 we where able to match only a subset of
the control variables which were comparable with 2005 and 2007/08. All
control variables are summarised in Table 1,
where we indicate when the variable was computed also for 2003.
|
|
|
|
Control
variables
|
Description |
2003 |
|
|
|
|
HHMemb2 |
= 1 if HH members are <
2 |
Yes |
|
HHMemb5 |
= 1 if HH members are <
5 & >
2 |
Yes |
|
HHMemb10 |
= 1 if HH members are <
10 & >
5 |
Yes |
|
HHMemb15 |
= 1 if HH members are <
15 & >
10 |
Yes |
|
HHMemb20 |
= 1 if HH members are <
20 & >
15 |
Yes |
|
MaleH |
= 1 if the household head is a
male |
Yes |
|
AgeHH |
Age of the HH head |
Yes |
|
GenderAvHH |
Average gender of the HH |
Yes |
|
LiteracyH |
= 1 if the HH head is literate
|
Yes |
|
LiteracyAvHH |
Average literacy of the HH members
|
Yes |
|
hhassets |
Number of assets in the HH |
Yes |
|
Rural |
= 1 if the HH lives in a rural
area |
No |
|
Credit_Inst
|
= 1 if the HH obtained credit the
previous year: credit institution |
No |
|
Credit_Lender
|
= 1 if the HH obtained credit the
previous year: private lender |
No |
|
Credit_Inform
|
= 1 if the HH obtained credit the
previous year: informal source |
No |
|
Credit_Other
|
= 1 if the HH obtained credit the
previous year: other sources |
No |
|
Credit_None
|
= 1 if the HH did not obtain
credit the previous year |
No |
|
Loan |
= 1 if the HH obtained credit the
previous year |
No |
|
HHMigration |
= 1 if any HH member migrated the
previous year |
Yes |
|
shocks |
= 1 if the HH experienced a shock
in the previous year |
Yes |
|
Dremittances |
= 1 if the HH received remittance
the previous year |
No |
|
DSocialContr |
= 1 if the HH received any social
aid the previous year |
No |
|
RoadKm |
Km from the closest road |
No |
|
DElectrNo |
= 1 if the HH has no access to
electricity |
No |
|
DMkt_Close
|
= 1 if the HH is close to the
market |
No |
|
Aunemp_ratio
|
% of unemployed adults (older than
13) in the cell |
Yes |
|
perc_opium_act
|
% of households cultivating opium
in the cell |
No |
|
|
|
Table 1: Control
variables harmonised across waves.
All the
variables were available for
2005-2007/8
The relevant choices we made in order to make the
most problematic variables comparable across waves are summarised
below.
First, hhassets (2003-2007/8),
includes
the number of households assets which were available in all
the three rounds of the survey: radio, bicycle, TV, motorcycle and car.
Second, shocks (2003-2007/8),
counts
only the number of shocks experienced by the households which
were asked in all the three rounds of the survey: unusually high level
of crops, unusually high level of livestock, earthquakes, landslides,
flooding, late damaging frost, hailstorms, unusually high increases in
food prices, and unusual decrease in farm gate prices.
Third, DMkt_Close
(2005-2007/8), computes the
presence of a close market differently for 2005 and for 2007/8. For
2005 the dummy is equal to one if either in winter or in the summer the
market is in the same village were the interviewed households live, or
it takes less than one hour to reach it by foot, public transport, or
private vehicle (male shura questionnaire, Section 3). For 2007/8 the
dummy variable is equal to one if the market is in the same village of
the interviewed households (male community questionnaire Section 3).
Fourth, Aunemp_ratio
(2005-2007/8), is the average
unemployment ratio in the area (district or cell).Because the section
on individual employment is missing in the 2005 questionnaire, for this
year we imputed the average area employment ratio between 2003 and
2007/8.
1.2.2
Private Economic Activity
The definition on the
household's PEA is built using the the main source of the
household income, for 2005-2007/8. Both waves use the same options,
which makes the comparison seamless, allowing to define a number of
different types of PEA. However, in order to harmonise the information
on PEA also with the 2003 wave we faced two main challenges.
First, the 2003 questionnaire is less detailed and
the information in the labour section (Section F) allows to identify
only four PEA comparable with the information from the 2005-2007/8
surveys: business and self employment, which can be further divided
into agricultural and non-agricultural.
Second, the 2003 survey does not contain information
on the sources of household income, but collects information on the
household members' employment (including self employment). On
the other hand, in 2005 there is no section collecting labour
information. Fortunately, in the 2007/8 survey both sections were
available: income sources, as in 2005 (Section 8), and on employment,
as in 2003 (Section 9). This allowed us to compare two different
measures of the main household occupational choice: one reflecting the
main source of household income (comparable with 2005), and one
reflecting the activity where each household member was employed
(comparable with 2003). Correlating measures of self employment using
the two sources allowed to use the definition of self employment in
2003 (defined through the employment sections) that is closer to the
corresponding definition used for 2005-2007/8 (defined through the
income section).
Table 2
compares the correlation between the level of self employment in non
agricultural activity, measured as the main source of income
(se_na -- see definition below), and
different measures of the level of self employment, measured as the
relative number of individuals working as
self
employed in non agricultural activities. Bot levels are computed
for the 2007-8 NRVA survey, using the income and labour sections,
respectively. These are:
- hh_se_nagric:
is a dummy variable equal to 1 if at
least one individual in the household is self employed
in a non-agricultural activity
(members labour section).
- abs_majority_p:
is a dummy variable equal to 1 if the absolute
majority
of individuals in the household is self employed
in a non-agricultural activity
(members labour section).
- rel_majority_p:
is a dummy variable equal to 1 if the relative
majority
of individuals in the household is self employed
in a non-agricultural activity
(members labour section).
Table 2: Correlations between self employment in non agriculture from different sections of the questionnaire. We use the income information and different measures of self employment from the labour section of the questionnaire. Source: own elaboration on NRVA survey 2007/8
Variables
|
(1)
|
(2)
|
(3)
|
(4)
|
Labour section variables
|
| hh_se_nagric_
p (1) |
1.000
|
|
|
|
| abs_majority_p
(2) |
0.562
|
1.000
|
|
|
| rel_majority_p
(3) |
0.659
|
0.600
|
1.000
|
|
|
| Income
section
variable |
| se_na
(4) |
0.515
|
0.344
|
0.377
|
1.000
|
Table 2
shows that we obtain the highest correlations when in the labour
section we define self employment considering that at least one member
of the household is self employed in a non agricultural activity.
Therefore, for 2003 one member of the household is enough to define
the
households as self employed. In this way we should capture households
occupational choice in a way that is close to the 2005 and 2007/8
definition where we have the information on the income sources.
At the end of the harmonisation process of the PEA
variables across the different waves, we obtain two different groups
of
variables. First, the longest panel (2003-2005-2007/8) includes the
following definitions of PEA for all years.
- bus
- 2003: identifies households for which the
relative majority of the members answered 'private
business' when asked about their main occupation, and
'self-employed' when asked about how they were paid.
- 2005-07/8: identifies households which
answered that a 'small business' was their main
source of income. That is, not all
business owners, if the business was not the main source.
- se_na
- 2003: identifies households for which the
relative majority of the members answered 'self-employed'
when asked about their main occupation, 'self-employed'
when asked about how they were paid, and who's main activity at
place of job differed from agriculture,
as well as from mining, education or health and administrative
(office).
- 2005-07/8: identifies households which
answered that one of the non agricultural activities listed in
Table 3, first
column, was their main source
of
income.
- agric
- 2003: identifies households for which the
relative majority of the members answered 'self-employed'
when asked about their main occupation, 'self-employed'
when asked about how they were paid, and who's main activity at
place of job is only agriculture.
- 2005-07/8: identifies households which
answered that one of the agricultural activities listed in Table 3,
fourth
column, was their main source
of
income.
|
Income source
|
Self
employment
types
|
|
|
(1) |
(2) |
(3) |
(4) |
(5) |
(6) |
|
|
se_na
|
Low_K
|
High_K
|
agric |
agr_sub
|
agr_sale
|
|
|
|
|
|
|
|
|
Crop production for
home consumption
|
|
|
|
Yes |
Yes |
|
|
Livestock
production for
home consumption
|
|
|
|
Yes |
Yes |
|
|
Production &
sale of
field crops
|
|
|
|
Yes |
|
Yes |
|
Prod & sales of
cash
crops (except Opium)
|
|
|
|
Yes |
|
Yes |
|
Prod & sales of
orchard products
|
|
|
|
Yes |
|
Yes |
|
Prod & sales of
livestock & products
|
|
|
|
Yes |
|
Yes |
|
Sales of prepared
foods
|
Yes |
Yes |
|
|
|
|
|
Miller
|
Yes |
|
Yes |
|
|
|
|
Petty trade/
shopkeeping
|
Yes |
Yes |
|
|
|
|
|
Cross border trade
|
Yes |
|
Yes |
|
|
|
|
Firewood /charcoal
sales
|
Yes |
Yes |
|
|
|
|
|
Handicrafts
(sewing,
embroidery, etc)
|
Yes |
Yes |
|
|
|
|
|
Carpet weaving
|
Yes |
Yes |
|
|
|
|
|
Taxi/transport
|
Yes |
|
Yes |
|
|
|
Table 3: List
of the sources of
income considered as self-employment for 2005 and
2007/8. Source: own elaboration on NRVA data
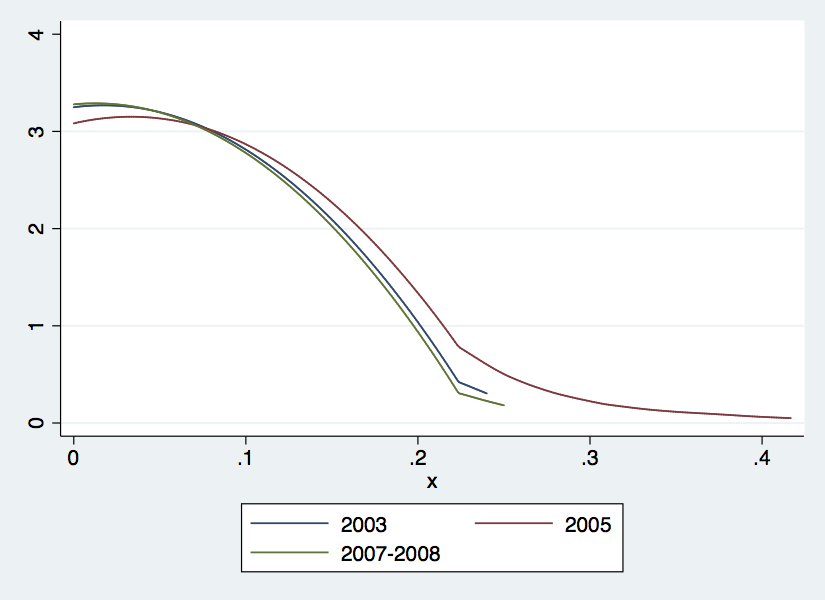
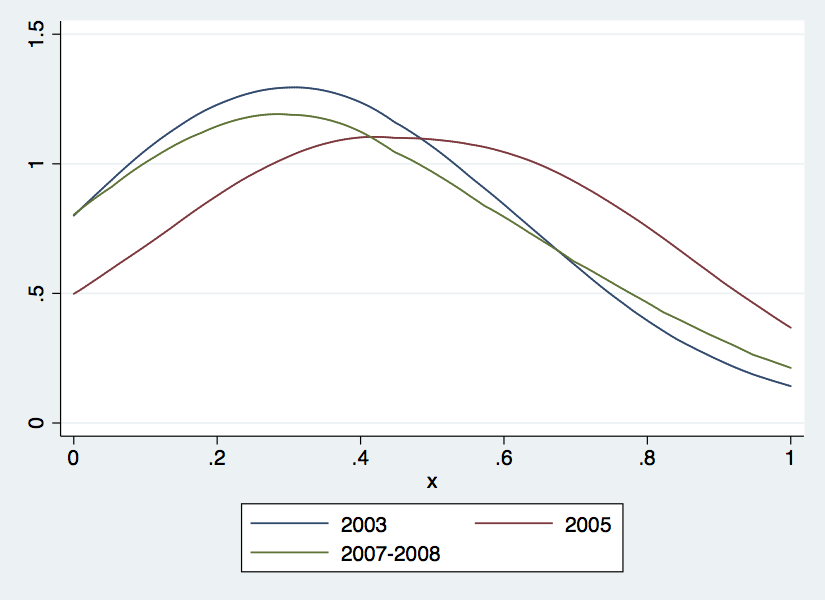
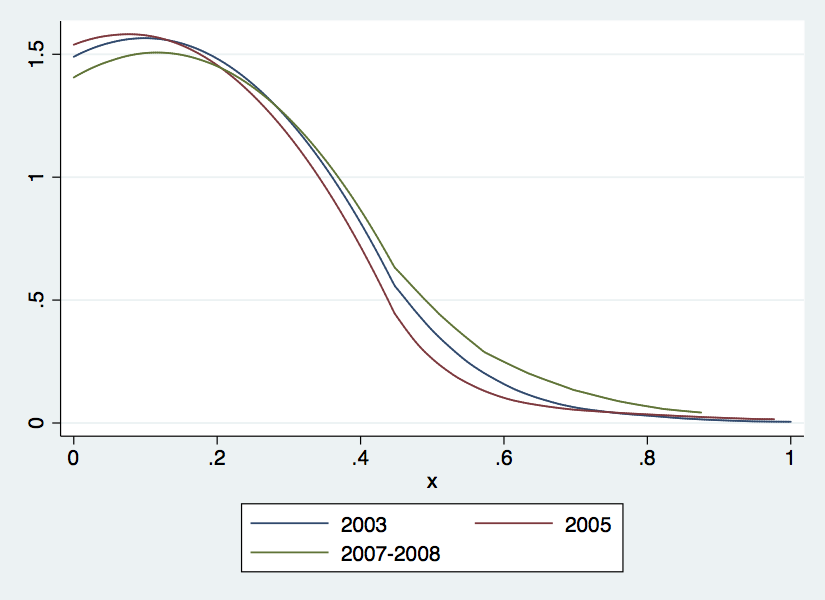
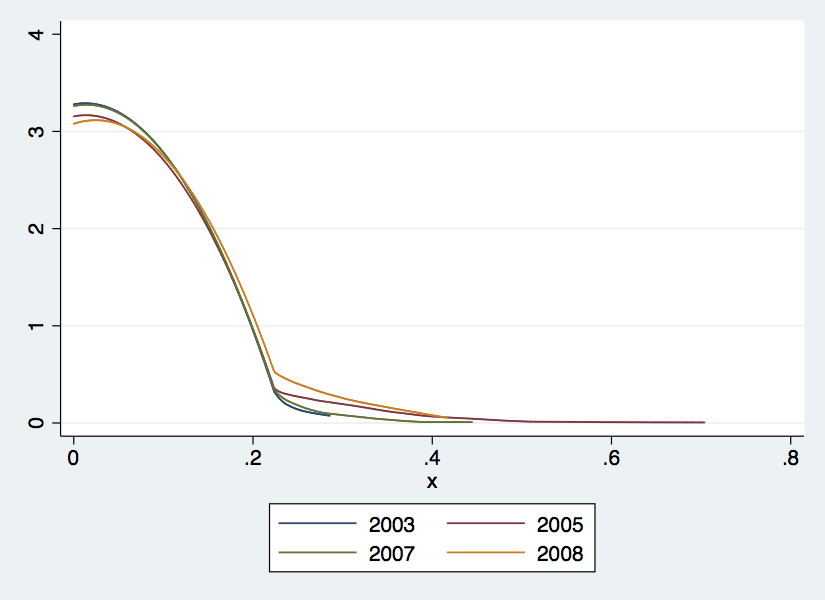
In Figure
1 we plot the
distribution of the four PEA types across districts in
2003, 2005 and 2007/8. The similarity of the distributions across years
suggests that the harmonisation of the PEA variable captures similar
household activities, allowing for a comparison across all years.
The figure also shows that in 2005 there is the
highest density of household holding a self employment activity. This
is due to a significant difference in the number of self employment
activities in agriculture, whereas the number of self employed in
non-agricultural activities is lower in 2005.
Second, for
the shorter 2005-07/8 database, we can include also the following more
detailed definitions of PEA:
- Low_K:
identifies households which answered
that one of the non agricultural activities that require a relatively
lower capital investment listed in Table 3,
second column, was their main source
of
income.
- High_K:
identifies households which answered
that one of the non agricultural activities that require a relatively
larger capital investment listed in Table 3,
third column, was their main source
of
income.
- agric:
identifies households which answered that one of the agricultural
activities listed in Table 3,
fourth column, was their main source
of
income.
- agr_sub:
identifies households which
answered that one of the agricultural activities for home consumption
listed in Table 3,
fifth column, was their main source
of
income.
- agr_sale:
identifies households which
answered that one of the agricultural activities which are not only
for
home consumption listed in Table 3,
sixth column, was their main source
of
income.
Finally, for the 2005-07/8 database we also
identified residual occupational variables, used to investigate if a
lower intensity of PEA translated in other occupational choices. The
NRVA questionnaires allowed to identify the following three residual
categories:
- Wage_Inc:
identifies households which
answered that one of the activities paid as employee listed in Table 4,
first
column, was their main source of
income.
- Opium_Inc:
identifies households which
answered that one of the activities related to the production of opium
listed in Table 4,
second column, was their main source
of
income.
- Other_Inc:
identifies households which
answered that their main source
of income was one of the residual sources listed in Table 4,
third
column.
|
Income source
|
Paid
work, opium
& other income sources
|
|
|
(1) |
(2) |
(3) |
|
|
Wage_Inc
|
Opium_Inc
|
Other_Inc
|
|
|
|
|
|
Agricultural wage labour (Non Opium)
|
Yes |
|
|
|
Other wage labour
|
Yes |
|
|
|
Skilled labour
|
Yes |
|
|
|
Salary/Government job/Teacher/NGO/UN
|
Yes |
|
|
|
Military service
|
Yes |
|
|
|
Production & sale of opium
|
|
Yes |
|
|
Opium wage labour
|
|
Yes |
|
|
Shepherding
|
|
|
Yes |
|
Mining
|
|
|
Yes |
|
Remittances from seasonal migrants
|
|
|
Yes |
|
Remittances from family members living
permanently away from home
|
|
|
Yes |
|
Pension
|
|
|
Yes |
|
Other Government benefits
|
|
|
Yes |
|
Rental income
|
|
|
Yes |
|
Sale of food aid
|
|
|
Yes |
|
Begging
|
|
|
Yes |
|
Borrowing
|
|
|
Yes |
|
Other
|
|
|
Yes |
|
|
|
|
|
Table 4:
List of
the sources of
income not considered as PEA for 2005 and 2007/8. Source: own elaboration based on NRVA questionnaire
1.2.3
Afghan Districts
The administrative boundaries of Afghan districts
and provinces were subject to changes in 2005. We harmonized the
district boundaries of 2003 (392 districts) using the 2005 new
administrative division (398 districts). In our analysis we use a
partition of Afghanistan in 398 districts for all waves.
In
particular, we re-assigned 2003 households to the
newer 2005 districts using the village latitude and longitude and a
shape-file provided by the Afghanistan
Information and Management
Services (AIMS).
The allocation of households was implemented using ARCGIS.
For
2005-2007/8 we kept the same districts assigned
by the CSO but we matched their codes with the ones assigned through
ARCGIS to 2003 (district_
gis)
using the district names, in order
to obtain homogeneous codes for all the three NRVA waves.
1.2.4
Geo-References for 2007/2008 Villages
The analysis in this paper exploits the
geographical and time variation of households and of the conflict.
Until 2005 NRVA supplied data with the geo-location of the villages,
which makes the geographical analysis very attractive with these data.
The CSO policy changed since 2007/8 when the villages geo-references
were not included. We then assigned a geocode to the village (and each
of the households sampled from the village). No
codebook is available online but a nearly complete geocode codebook
can be purchased from AIMS.
We
assigned the coordinates to 2007-8 villages with
the following procedure. First, we matched the village's geocodes in our
sample with the AIMS
geo-referenced geocodes. Next, we matched the
unmatched villages using the geocodes in the 2005 wave for those
village that were sampled in both waves and which were located in the
same district and province. Finally, we matched the remaining few
villages with the
geographic gazetteer provided by Humanitarian
Response --
available online here
-- and that provided by AIMS
(matching the village, district, and province
names). After this procedure Only 48 households surveyed in 2007/8 were
left without geographical coordinates.
Conflict
Data: Afghan War Diaries
2.1 Afghan war diaries
The Afghan
War Diaries (AWD) is a
large dataset of conflict reports recorded
during the Afghan and the Iraq wars between 2004 and 2009 by US troops.
All reports contain a large amount of details on each registered event,
among which the geographical coordinates, the number of people
(soldiers and civilians) killed and wounded, and a description of the
action in which the military were involved. The data was collected by
soldiers and intelligence officers, and includes intelligence
information, reports of meetings with political partners, and related
details. Most of the reports were not cleared, which is likely to
reduce the likelihood of misreported events. The reports where assigned
to one among dozens of different categories that differentiate the
types of action, going from the Afghan Police training through indirect
fire and police actions, up to vehicle interdiction (please refer to
the war
diaries website
for details).
Immediately after their release, the reports were
machine coded into a large database detailing a large number of
variables, including geographic coordinates, number of people involved
and killed or wounded, types of action, perpetrators, etc. (see for
example the Guardian).
A number of
studies have verified the reliability and the accuracy of these
conflict data (see for example the discussion in Zammit-Mangion
et
al. (2012)).
In order to use these data for our analysis, first,
we define the 'relevant' conflict events as those events
that may cause disruption of economic activity, or fear, or any other
condition that we think that could affect households' behaviour.
We
do so using the conflict category (see also
https://www.wikileaks.org/afg/),
and
excluding categories such as unexploded bombs or medical
interventions. We list all the categories forming the set of 'relevant'
conflict events in Table
5.
We use the events in the excluded categories to define a different
variable (
no_
conflict)
identifying the presence of US
military, to control whether military activity, and related aid, with
little impact on
the perception of violent conflict, impacts private economic activity.
This way we also make sure that we are fully exploiting the richness of
the data.
Second, we
assigned each conflict event to an area
(district and cell) to construct the different aggregate measure of
conflict per area.
|
Activities
|
Definition
|
|
AIR ASSAULT
|
conflict
air operations
|
|
|
AMBUSH |
ambushes
that most of the
times end up with wounded/killed and
with
explosions
|
|
|
AMF-ON-ANA
|
events
where a fire, even
if friendly, occurred
|
|
|
ANA-ON-ANP
|
events
where a fire, even
if friendly, occurred
|
|
|
ARSON |
actions
where
buildings/infrastructures were set on fire
|
|
|
ASSASSINATION
|
events
where people were
killed
|
|
|
ATTACK |
events
where someone was
attacked. Not necessarily involves wounded/killed
|
|
|
BLUE-GREEN
|
events
where there is a
fire
|
|
|
BLUE-BLUE
|
events
where there is a
fire
|
|
|
BLUE/WHITE
|
events
where there is a
fire
|
|
|
BREACHING
|
events
with fire and
possibly casualties
|
|
|
CARJACKING
|
mainly
enemies hijacking
cars or other private vehicles
|
|
|
CCA |
diverse
suspicious events
|
|
|
CAS |
events
where helicopters
are involved in the attack
|
|
|
CLOSE AIR SUPPORT
|
events
where helicopters
are involved in the attack
|
|
|
COUNTER INSURGENCY
|
violent
actions
|
|
|
COUNTER MORTAR FIRE
|
events
where there is a
fire
|
|
|
CRIMINAL ACTIVITY
|
it can
include
explosions, theft, wounded journalists during attacks
|
|
|
DELIBERATE ATTACK
|
it
includes diverse
violent actions, sometimes with wounded/killed
individuals
|
|
|
DIRECT FIRE
|
events
where there is a
fire
|
|
|
DOWNED AIRCRAFT
|
it
describes operations
where aircrafts were downed
|
|
|
DRUG OPERATION
|
it can
include fires and
violent actions
|
|
|
ENEMY ACTION
|
it
describes violent
events with fire
|
|
|
ESCALATION OF FORCE
|
It
describes violent
actions with possibly wounded/killed
|
|
|
GREEN-BLUE
|
it
describes events where
there is a fire
|
|
|
GREEN-GREEN
|
it
describes events where
there is a fire
|
|
|
GREEN-WHITE
|
it
describes events where
there is a fire
|
|
|
DF COUNTER FIRE
|
it
describes events where
there is a fire
|
|
|
KIDNAPPING
|
it
describes operations
where someone was kidnapped
|
|
|
LOOTING |
it
describes operations
where a loot took place
|
|
|
MINE STRIKE
|
events
where there is an
explosion
|
|
|
MURDER |
it
describes operations
where someone was murdered
|
|
|
IED AMBUSH
|
attack
on US army using
Improvised Explosion Device
|
|
|
IDF INTERDICTION
|
prediction
of a future
fire/bombing while not happened yet
|
|
|
IED FOUND/CLEARED
|
IED
detonated by the US
military
|
|
|
IED EXPLOSION
|
mainly
bombs, or suicide
bombs against military and civilians
|
|
|
INTERDICTION
|
suicide
bombers are spot
and blocked, arrested, or killed, sometimes
the
IED explodes
|
|
|
SNIPER OPERATIONS
|
fire
starts from an
hidden place
|
|
TRIBAL |
fire
events. Violent
tribal disputes
|
|
|
TRIBAL FEUD
|
violent
tribal disputes
|
|
|
UAV |
(Unmanned
Aerial
Vehicle): Mixed events that can include fire, wounded/killed
|
|
|
POLICE ACTIONS
|
they
can be either
violent or not. They can include fire
|
|
MEDEVAC(LOCAL NATIONAL
|
medical
interventions
|
|
|
MINE FOUND/CLEARED
|
non-violent
event
|
|
|
MOVEMENT TO CONTACT
|
movement
in order to
contact the enemy. It can be violent but not
always
|
|
|
MUGGING |
it
describes operations
where someone was mugged
|
|
|
NARCOTICS
|
disruption
of a major
drug labs
|
|
|
NBC |
event
that describes a
show of force
|
|
NONE SELECTED
|
diverse
events some of
them violent
|
|
|
OTHER |
conflict
related event,
with fire, or explosion
|
|
|
OTHER (HOSTILE ACTION)
|
events
such as
kidnapping/killing/robbery
|
|
|
OTHER DEFENSIVE
|
it can
include
fire/violent events
|
|
|
OTHER OFFENSIVE
|
it can
include
fire/violent events
|
|
|
POLICE ACTIONS
|
they
can be either
violent or not. They can include fire
|
|
|
POLICE INTERNAL
|
violent
events with fire,
wounded/killed
|
|
|
PLANNED EVENT
|
mixed
evidence but mostly
violent events
|
|
|
PREMATURE DETONATION
|
explosive
events
|
|
|
RAID |
violent
events with
possibly wounded/killed individuals
|
|
|
RPG |
rocket-propelled
grenade
actions
|
|
|
SAFIRE |
surface
to air fire
|
|
SEARCH AND ATTACK
|
violent
actions with
possibly wounded/killed individuals
|
|
|
SECTARIAN VIOLENCE
|
violent
events such as
suicide bombers
|
|
|
SHOW OF FORCE
|
it
reports either battle
events or events where there is a fire
|
|
|
SMALL UNIT ACTIONS
|
violent
actions possibly
with direct fire, possibly with wounded/killed
individuals
|
|
|
SNIPER OPS
|
fire
started from an
hidden place
|
|
UNKNOWN EXPLOSION
|
explosive
event
|
|
|
VANDALISM
|
diverse
disruptive events
|
|
|
VOGE |
visual
observation of
ground explosion
|
|
|
Table 5: List of
categories included among the relevant
conflict events. Source: war
diaries website
|
2.2
Global
Dataset on Events, Location and Tone (GDELT)
GDELT is database that archives and assigns
geographical coordinates to all event reported in the news from 1979 to
date (see the web page for details:
http://gdeltproject.org/data.html).
We
used a database containing conflict events from 1979 to 2012,
similar to the one used in
Yonamine (2013).
Events related to conflict are classified as
material cooperation, verbal cooperation, verbal conflict and material
conflict.
In order to use these data for our analysis we first
delete conflict events duplicates. Next, we assign each conflict event
to an area (cell and district). Finally, we define one measure of
conflict per area, which sums all the events recorded in one year in
that area. To reduce the noise of events that may not be related to the
conflict, and that may have negligible effects on household behaviour,
we included in the count only the events that were classified as 'material
conflicts'.
2.3
Geographical Distribution of Conflict Events and Impact
In order to
control for different sources of
information we construct a number of measures of the intensity of
conflict, covering two or more of the HH survey years. Below we compare
the geographical
distribution through time of the conflict using the different measures
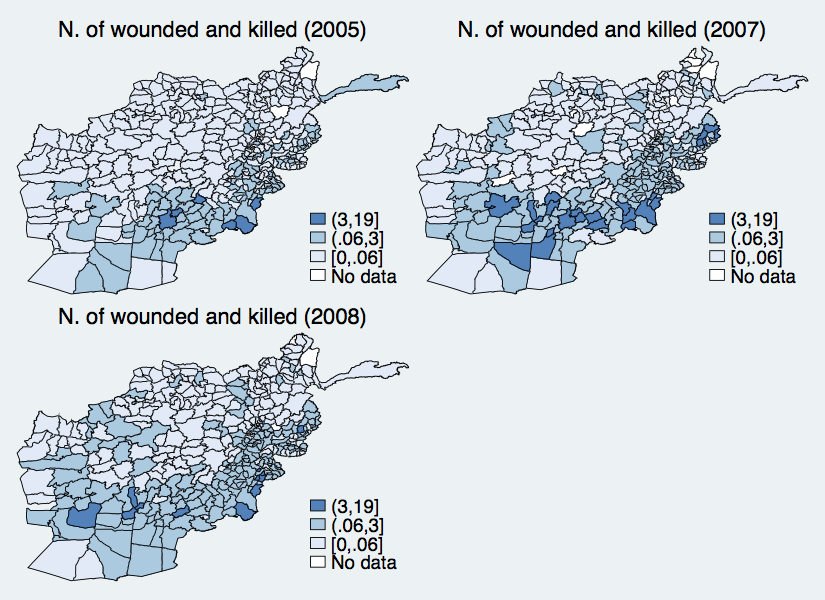
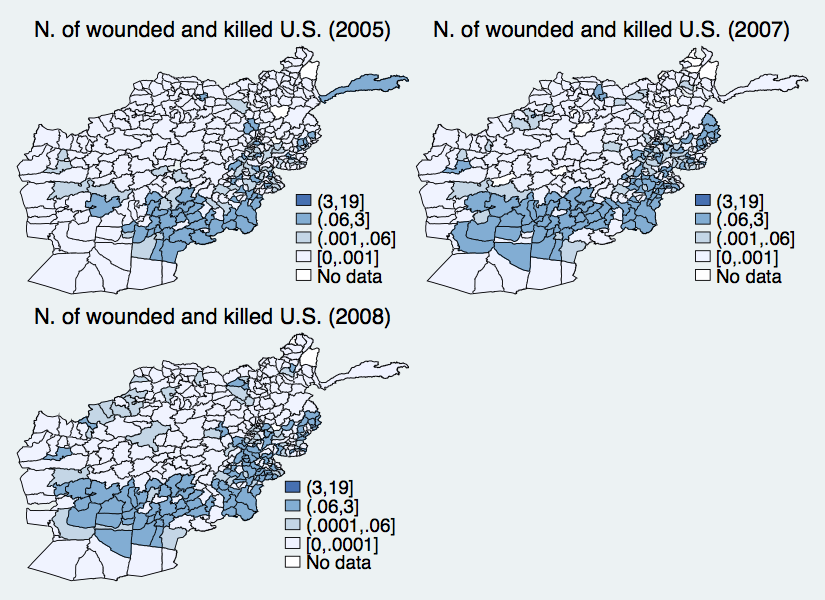
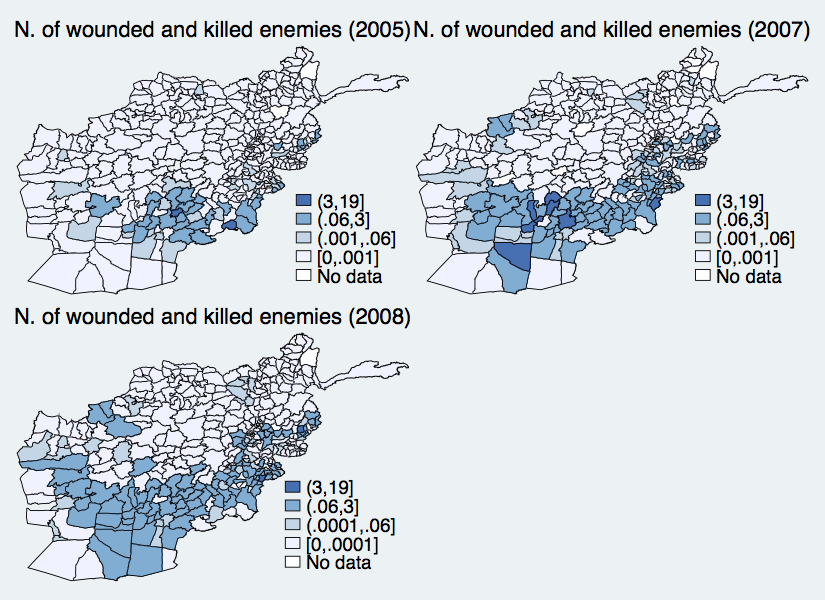
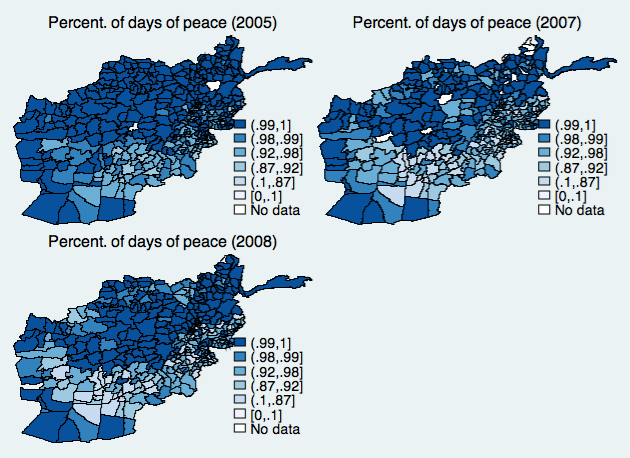
(all normalised by population). Figure 2:
number of
conflict events recorded by the US army (n_conflict);
Figure 3:
number of material conflict events recorded by the media (n_event4);
Figure
4:
number of individuals killed or wounded (n_
wk);
Figure 5:
number of U.S soldiers killed or wounded ( n_wk_usa);
Figure
6:
number of Afghan civilians wounded or killed (n_
wk_civ);
Figure 7:
number of insurgents wounded or killed (n_
wk_ins);
Figure
8:
percentage of days in a year in which no relevant conflict occurs in
the district (peace_
days);
and Figure 9:
percentage of households that experience a shock related to violence
and insecurity ( p_shockins).
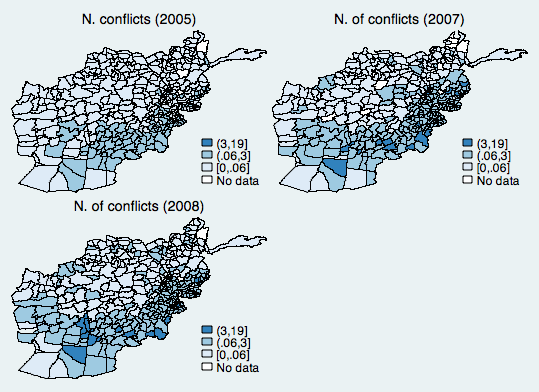 |
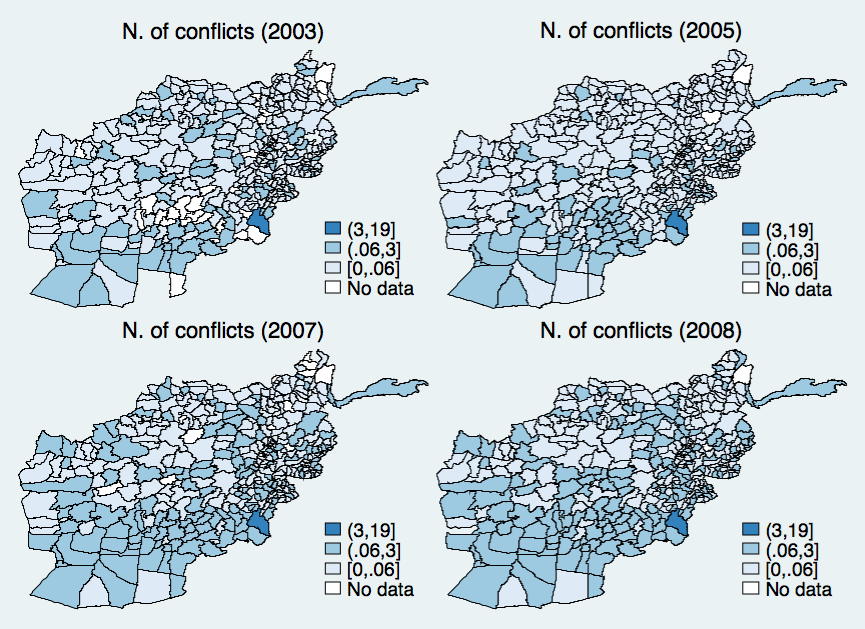 |
Figure 2:
Number
of relevant
conflicts recorded by the US army per district, 2005-2008.
Conflicts are normalised by the district population. Source:
own calculations based on AWD
|
Figure 3:
Number
of conflicts
recorded by the media per district, 2003-2008.
Conflicts
are normalised by the district population. Source:
own calculations based on GDELT |
 |
 |
| Figure 4:
Number
of total
individuals wounded and killed recorded by the US
army per district, 2005-2008.
Wounded and killed are normalised by the
district population. Source:
own calculations based on AWD |
Figure 5:
Number
of U.S. soldiers
wounded and killed recorded by the US army per
district, 2005-2008.
Wounded and killed are normalised by the
district population. Source:
own calculations based on AWD |
 |
 |
| Figure 6:
Number
of civilians
wounded and killed recorded by the US army per
district, 2005-2008.
Wounded and killed are normalised by the
district population. Source:
own calculations based on AWD |
Figure 7:
Number
of insurgents
wounded and killed recorded by the US army per
district, 2005-2008.
Wounded and killed are normalised by the
district population. Source:
own calculations based on AWD |
 |
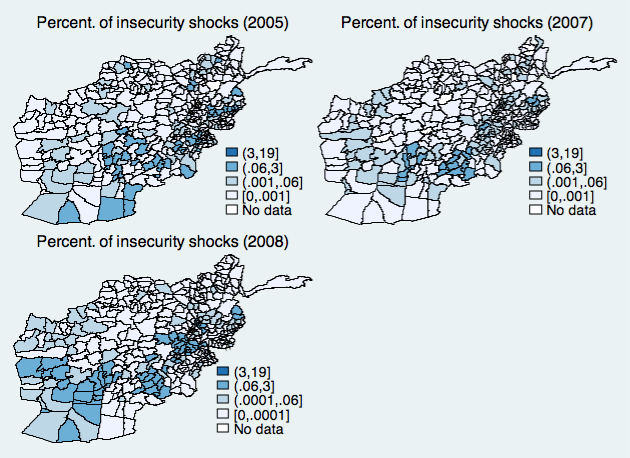 |
Figure 8:
Percentage
of days in a
year in which there is no relevant conflict.
Density. Source:
own calculations based on AWD
|
Figure 9:
Percentage
of households
in a district that have experienced a shock related
to violence and insecurity in t
-1.
Density. Source:
own calculations based on AWD |
2.4 Geographical
Distribution: Comparing Sources and Data
Next, we compare the geographical distribution of
conflict events estimated with the variables used for this paper with
the geographical distribution of conflict in Afghanistan estimated
using different data sources, methods, or variables.
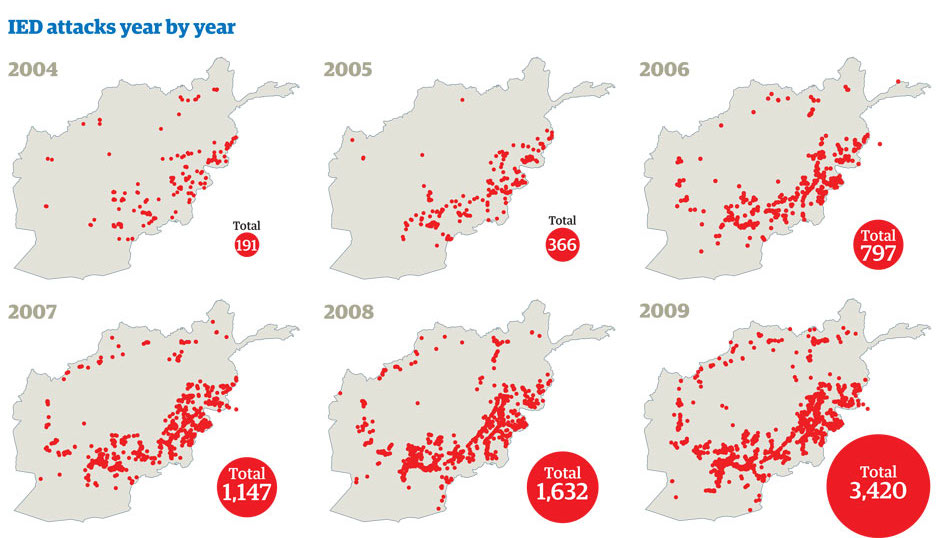
The Guardian
newspaper was the first one to publish
figures using the Afghan Warlogs (accessible here).
For
instance, Figure 10
maps the distribution of IED attacks in Afghanistan from 2004 through
2009.
The
geographical distribution is very similar to the
one plotted int the figures above using the same source of data and
normalised by population size. Moreover, the Guardian data also show a
sharp increase in the intensity of conflict between 2005 and 2008, and
how it spreads to initially unaffected areas in the North of the
country.
|
Figure 10:
IED
attacks per year in
Afghanistan.
From the Afghan
Warlogs data published
by The
Guardian newspaper. Source: Guardian
website
|
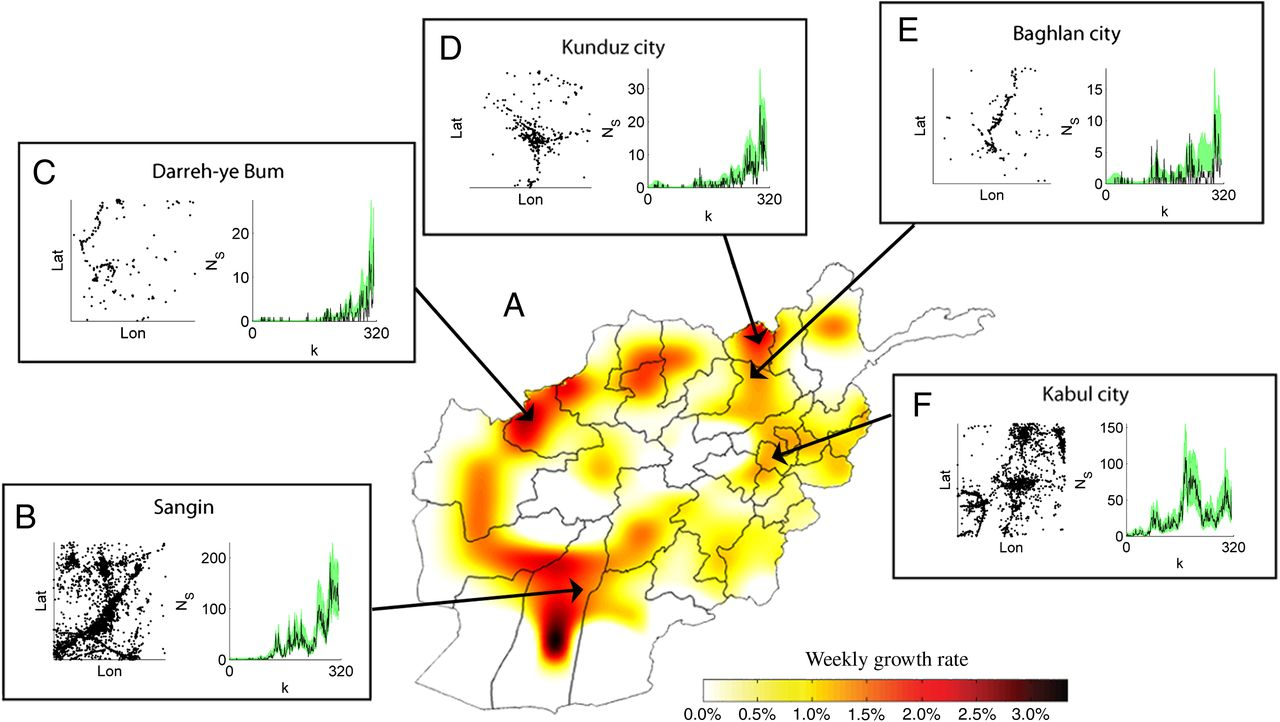
Also using the Afghan war diaries
Zammit-Mangion
et
al. (2012)
suggest a very similar
geographical distribution of the number of logs through years (see the
paper supporting material), covering all events, not only the ones that
may be considered relevant for economic decisions. Perhaps more
interesting to show here is the escalation of conflict between 2004 and
2009 across Afghanistan (see the original paper for details on how this is
modelled).
In Figure
11
we report Figure 2 from
Zammit-Mangion
et al. (
2012)
where they plot the weekly growth in the
number of events registered in the Afghan war diaries. The figure
confirms what the other figures have shown: the conflict increases
mainly in the Helmand province and in the North, where in 2004 there
were no activities registered. The less significant increase in the
South, were the conflict is more pronounced is due to the fact that the
number of activities were relatively already very high in 2004.
|
Figure 11:
Growth
of the conflict
activities registered in the Afghan war diaries
between
2004 and 2009. Only
regions with positive overall growth.
For more details about
the figure
see the source: Zammit-Mangion
et
al. (2012
)
|
Very
similar results on the number of deaths and
wounding by year are reported by the Visualizing data website,
as shown in Figure 12.
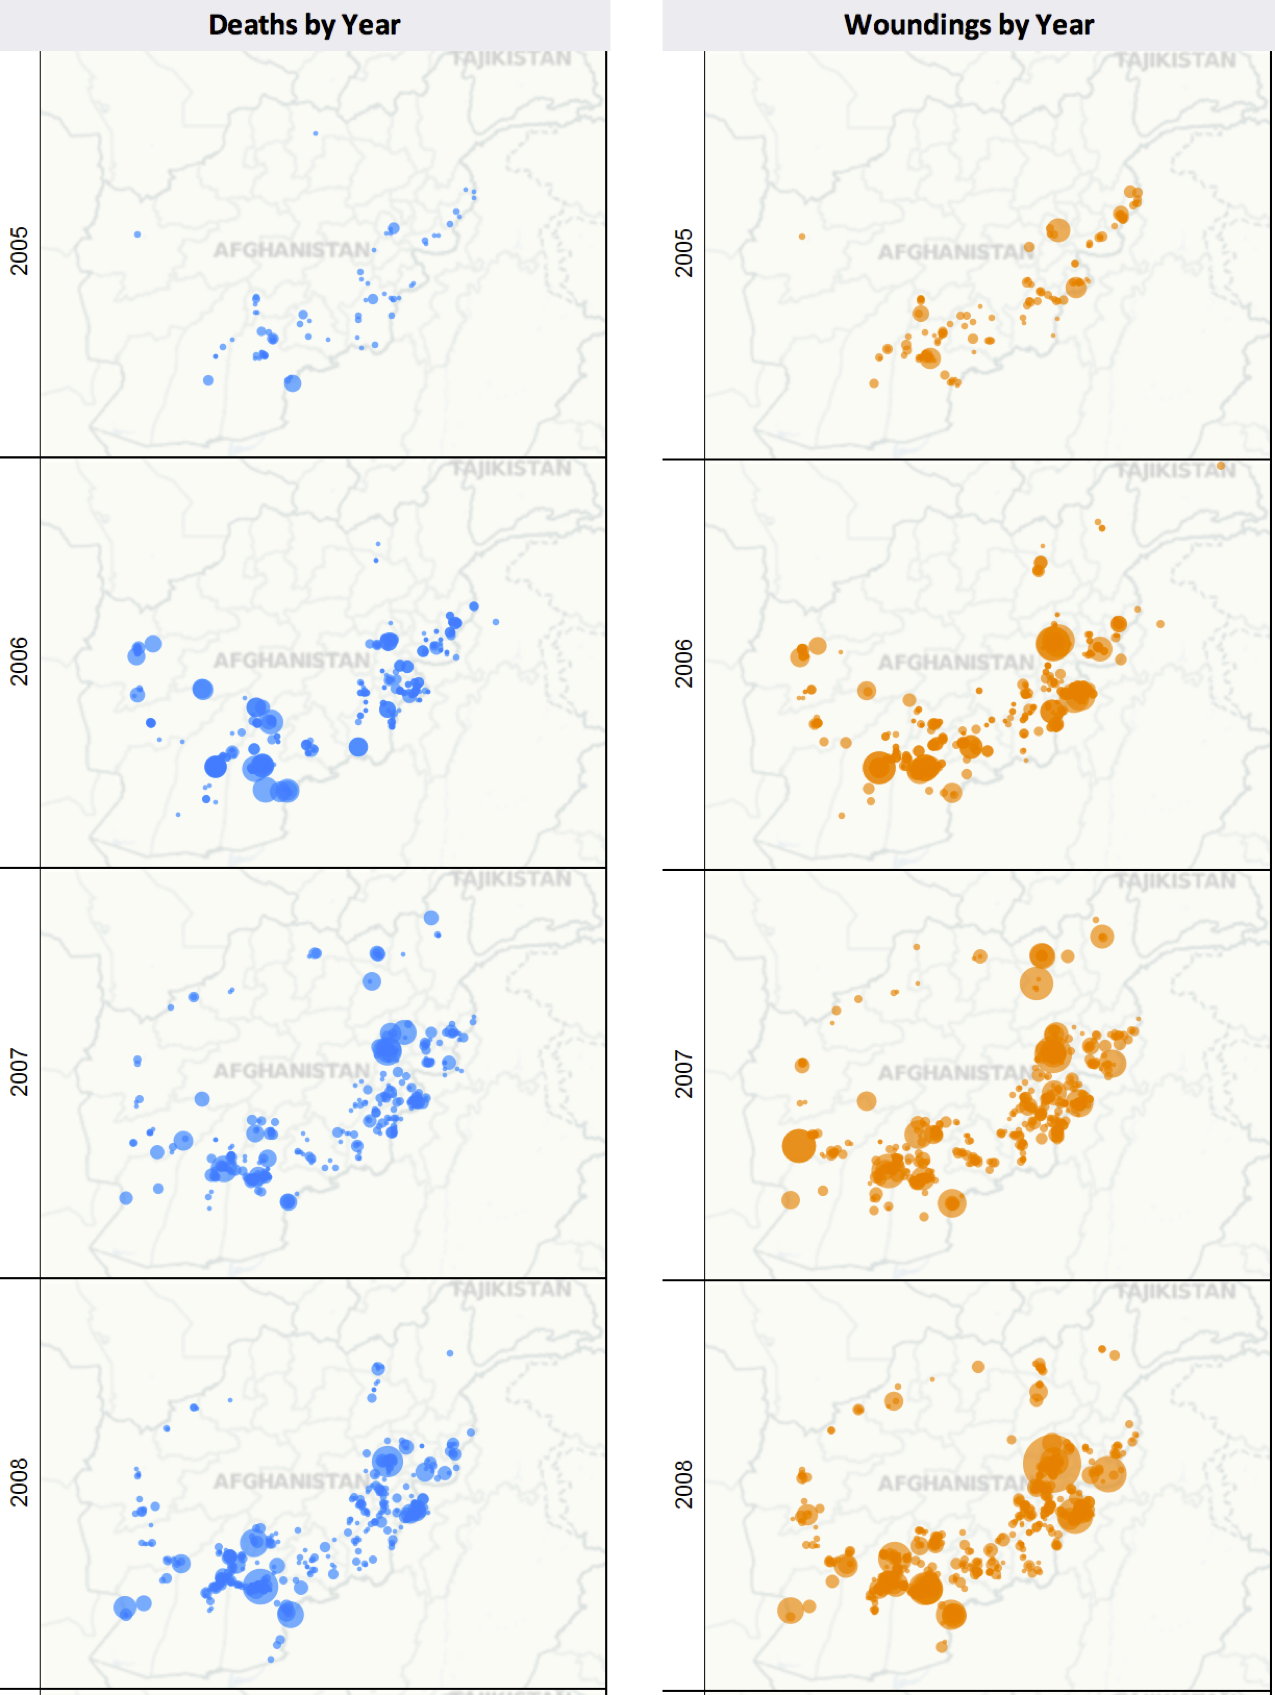 |
Figure 12:
Number
of deaths and
wounding using the Afghan war diaries
(2005-2008).
Source: Visualising
data
|
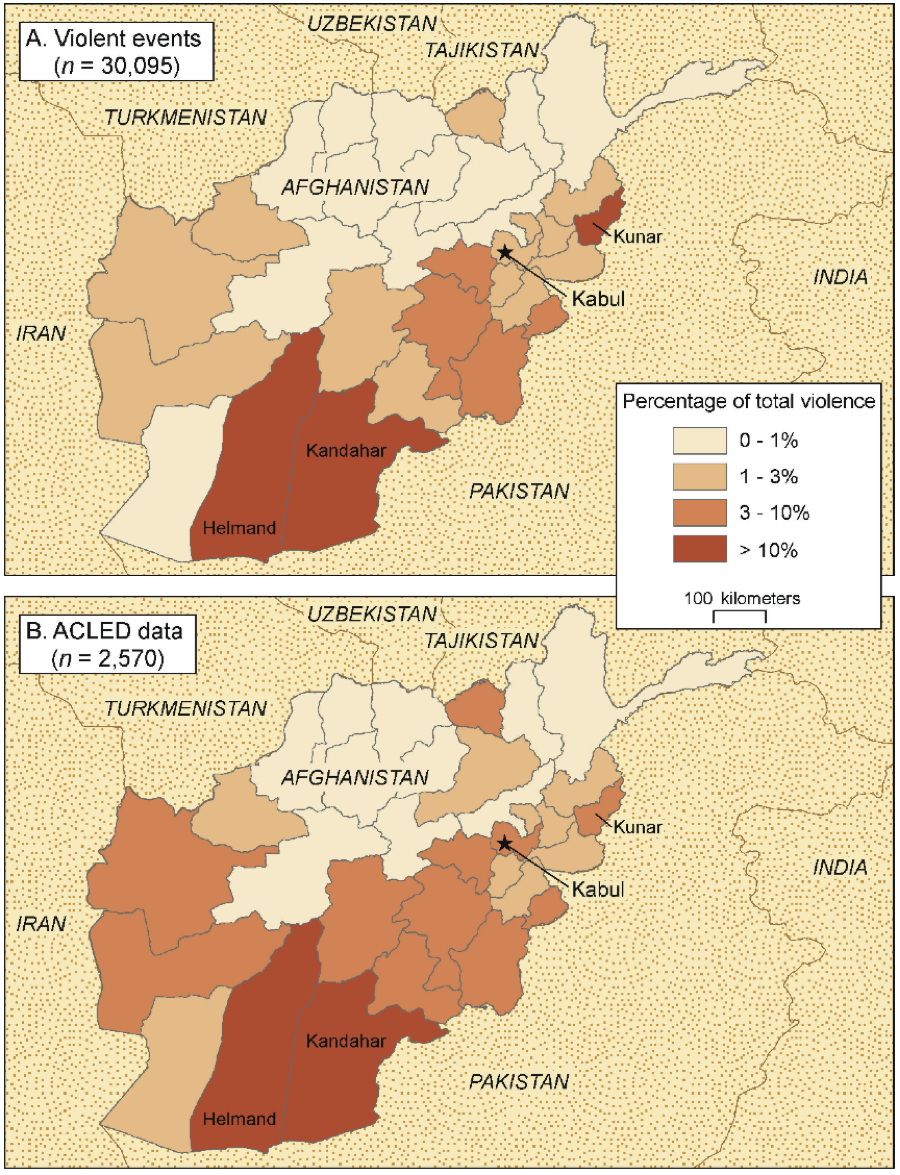
Finally, O'Loughlin
et al.
(2010)
compare the conflict figures from the Afghan
war diaries with those from the Armed Conflict Location & Event
Data Project (ACLED). In Figure 13
we report the authors figure number 5 where they plot the geographical
distribution of the share of violent event data per province with
respect to the total number of events.
Although data availability in ACLED limits the
comparison to the years 2008 and 2009, the figure shows a strong
similarity in the geographical distribution of conflict captured by
different data sources.
|
Figure 13:
Share
of conflict per
province with respect to the total number of
conflict
in the country (2008-2009).
The authors use the Afghanistan war diaries
and ACLED. The
restrictions on the
period compared is due to the data availability in ACLED
(2008-09). Source: O'Loughlin
et al.
(2010)
|
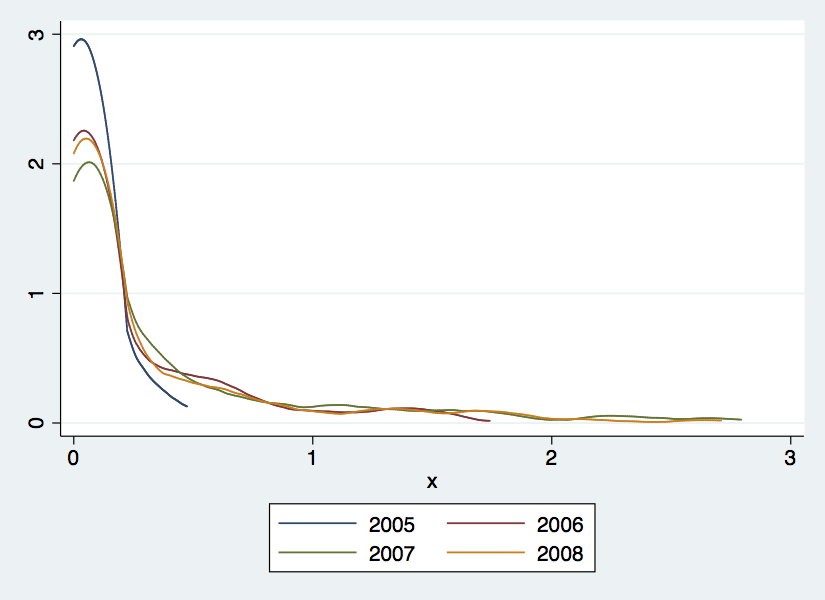
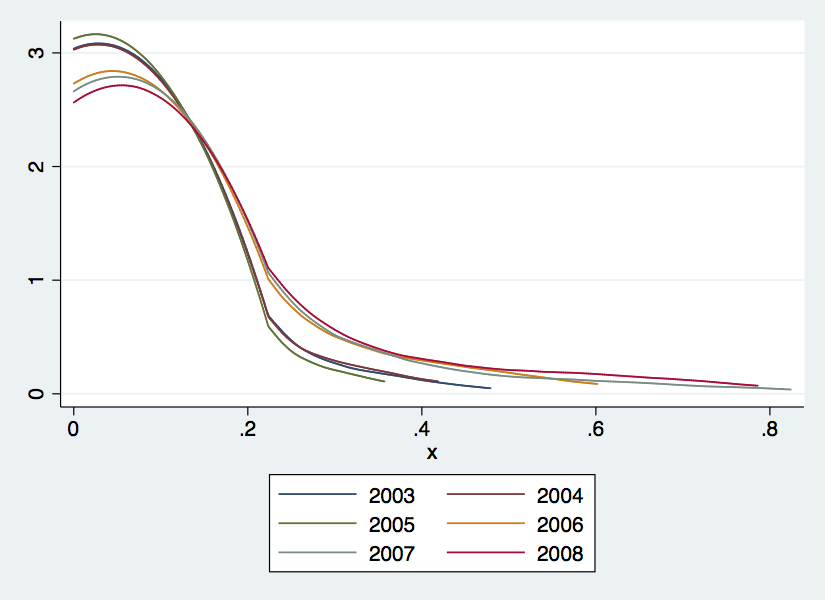
2.5 Time Distribution: Comparing
Data Sources
We
compare
the distribution of conflict across districts, for different
years, emerging from the different data sources employed in this paper
to compute different indicators of conflict intensity: Afghan War
Diaries (a), GDELT (b), and the experience of violent shocks from NRVA
(c). Figure 14
shows that the different measures and data sources suggest a similar
intensification of the conflict from 2003 (when available) to 2008. All
measures also suggest the same skewness in the distribution, with many
districts experiencing relatively low conflict, and a small number of
districts experiencing intense conflicts
|
|
(a)
Afghan war diaries (AWD)
|
(b)
GDELT
|
|
|
|
(c) NRVA
Shock Insecurity
|
|
|
Figure
14: Kernel density of conflict
intensity (normalized by population per district) for different
years. Source: own
computation based on AWD, GDELT and NRVA (different years)
|
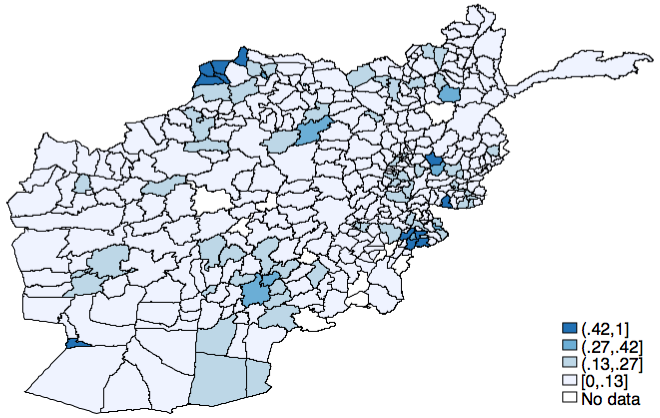
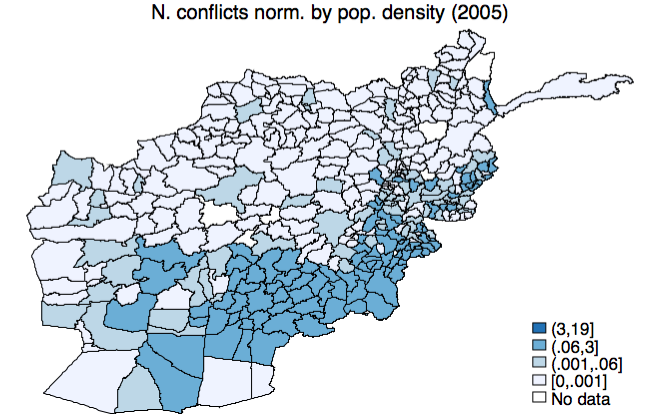
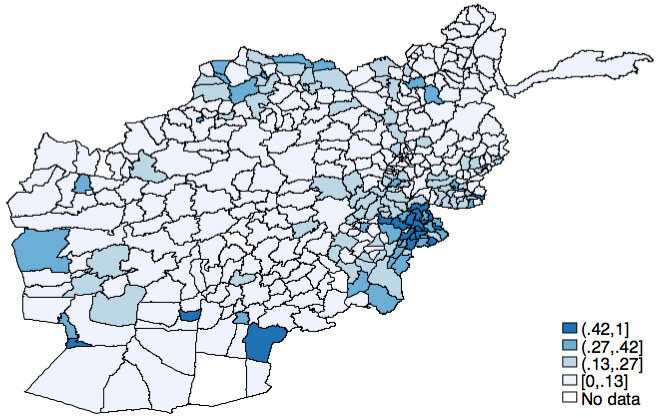
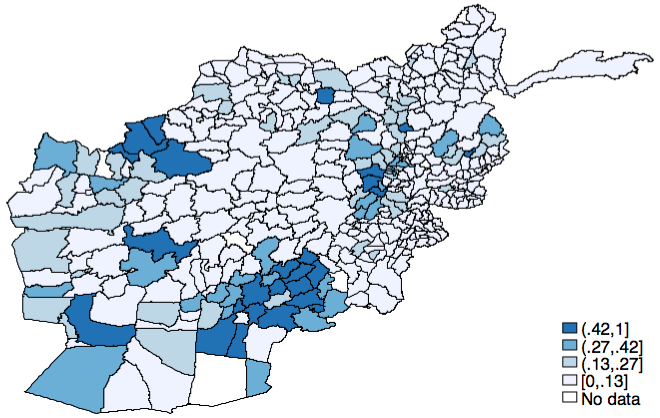
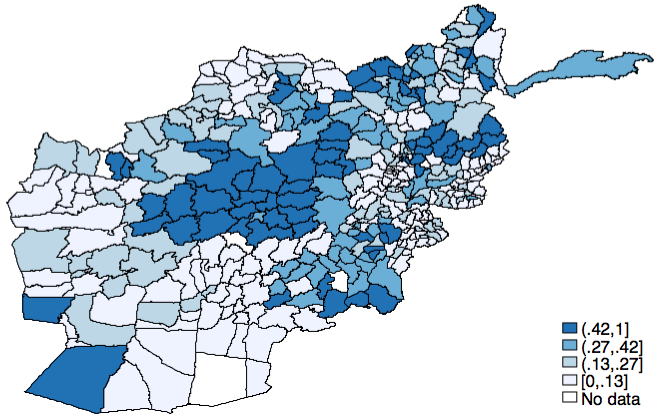
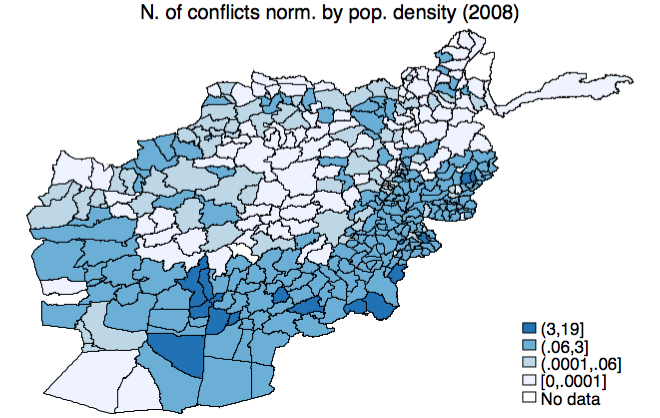
Geographical Distribution of Conflict and Private Economic Activities
In
the
paper we exploit the time and space variation of different types of
entrepreneurial activities and different indicators of conflict. As an
example, in Figures 15 and 16
we contrast the geographical distribution across districts for a number
of agricultural activities and the number of 'relevant' conflicts
recorded in the AWD (normalised by the district population), for 2005
and 2008.
|
|
(a) Non
agricultural self employment
|
(b)
Agriculture for sale
|
|
|
|
|
(c)
Subsistence agriculture
|
(d)
Conflict intensity per capita
|
|
|
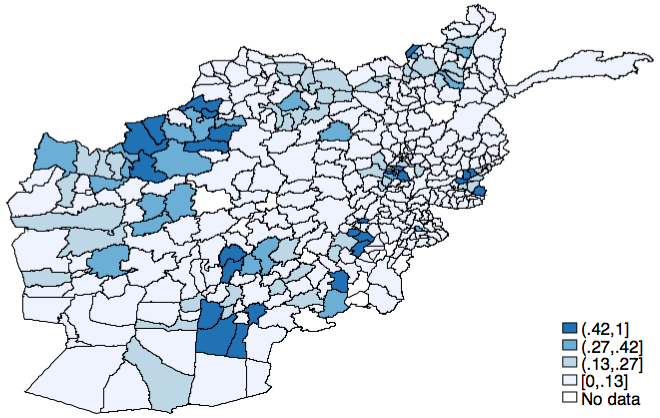
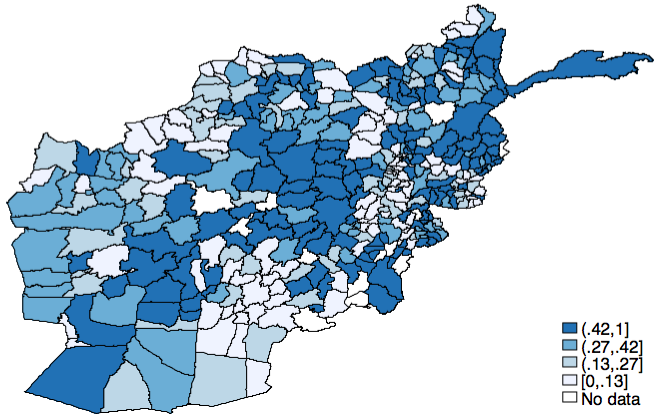
Figure
15: Percentage of household
activity per district and conflict intensity: 2005. %
of self employed in non agricultural activities per district (a);
% of
self employed in agriculture for sale per district (b); % of self
employed in subsistence agriculture per district (c); number of
conflict per district normalised by population (d). The intensity
of
the colour indicates the percentage of households in the district
owning a particular activity (a-c) and the normalised number of
conflict events (d) Source: own elaboration on NRVA and AWD data.
|
|
|
(a) Non
agricultural self employment
|
(b)
Agriculture for sale
|
|
|
|
|
(c)
Subsistence agriculture
|
(d)
Conflict intensity per capita
|
|
|
Figure
15: Percentage of household
activity per district and conflict intensity: 2008. %
of self employed in non agricultural activities per district (a);
% of
self employed in agriculture for sale per district (b); % of self
employed in subsistence agriculture per district (c); number of
conflict per district normalised by population (d). The intensity
of
the colour indicates the percentage of households in the district
owning a particular activity (a-c) and the normalised number of
conflict events (d) Source: own elaboration on NRVA and AWD data.
|
Footnotes
1
This information is available in "Summary of the National Risk and
Vulnerability Assessment 2007/2008" paragraph 2, Jehoon Printing Press
2
See O'Loughlin eta al. (2010) for a similar classification. Our results
using their classification of violent events, instead of our
classification of 'relevant' events, do not change.
References
O'Loughlin, John,
Frank D W Witmer, Andrew M
Linke, and Nancy Thorwardson,
"Peering into the Fog
of War: The Geography of the WikiLeaks Afghanistan War Logs,
2004-2009," Eurasian Geography and
Economics, 2010, 51 (4),
472-495.
Yonamine,
James E,
"Predicting Future Levels
Of Violence In Afghanistan Districts Using GDELT," Working Paper,
Penn State University, 2013.
Zammit-Mangion,
Andrew, Michael Dewar, Visakan
Kadirkamanathan,
and
Guido
Sanguinetti,
"Point process modelling of the Afghan War
Diary," Proceedings
of the National
Academy of Sciences,
2012, 109
(31),
12414-12419.