Filter 72
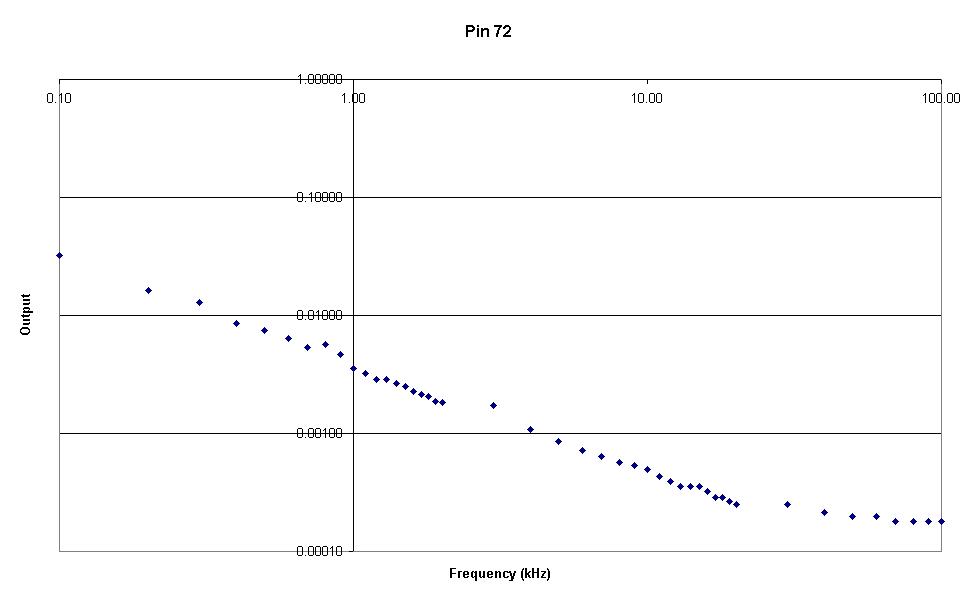
The following table shows the data obtained from the filter. The following graph shows the response curve, which is the scaled output plotted on a logarithmic scale.
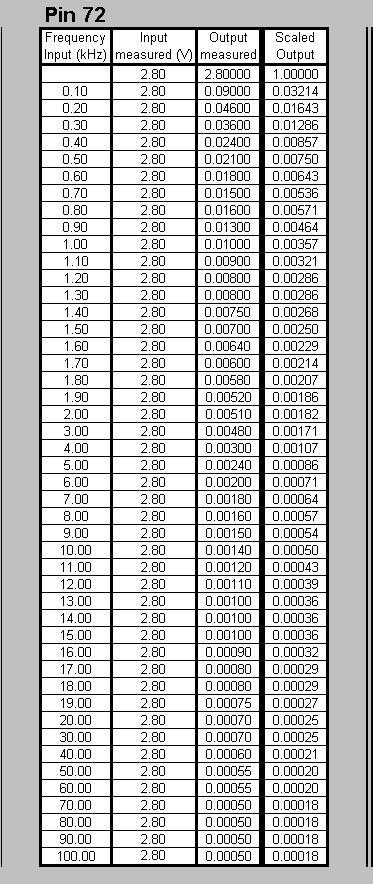
The following table shows the data obtained from the filter. The following graph shows the response curve, which is the scaled output plotted on a logarithmic scale.