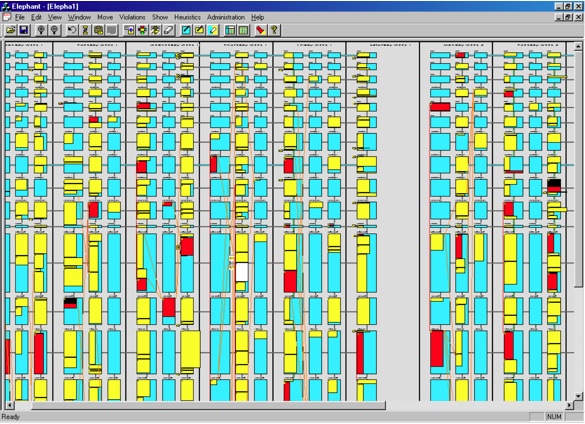
Event Scheduling: STARK-exam
This is a novel graphical
interface for event scheduling (examination
timetabling). The evaluations of the system showed
that novices could quickly learn to use the system and
were able to generate solutions of a quality to match
commercial strength automated scheduling systems.
The design of the interface reveals the underlying
structure of the task domain to users, with the
consequence that they can use sophisticated recursive
strategies rather than the trial-and-error approaches
observed with conventional graphical interfaces.
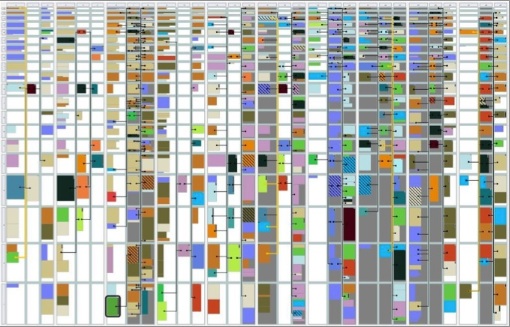
Yellow exam icons are allocated to blue room/time
slots. All horizontal dimensions are temporal
properties (day, time and durations of slots and exams)
and all vertical dimensions are spatial properties (rooms,
seating capacity, exam size). Violating exams are
shown by connecting lines between the icons. The red
icon reveals all the exams taken by anyone in the selected
white exam (centre), which enables the user so easily see
where it may be re-allocated to eliminate conflicts
without causing new violations.
Cheng,
P. C.-H., Barone, R., Cowling, P. I., & Ahmadi, S.
(2002). Opening the information bottleneck in
complex scheduling problems with a novel representation:
STARK diagrams. In M. Hegarty, B. Meyer & N. H.
Narayanan (Eds.), Diagrammatic representations and
inference: Second International Conference, Diagrams
2002 (pp. 264-278). Berlin: Springer-Verlag.
Cowling, P. I., Ahmadi, S., Cheng, P. C.-H., & Barone, R. (2002). Combining human and machine intelligence to produce effective examination timetables. In L.Wang, K. Tan, C. Furuhashi., J-H Kim, and X. Yao (Eds.), Proceedings of the 4th Asia-Pacific Conference on Simulated Evolution And Learning (SEAL2002), Singapore; (pp 662-666). (ISBN 981-04-7523-3).
Cowling, P. I., Ahmadi, S., Cheng, P. C.-H., & Barone, R. (2002). Combining human and machine intelligence to produce effective examination timetables. In L.Wang, K. Tan, C. Furuhashi., J-H Kim, and X. Yao (Eds.), Proceedings of the 4th Asia-Pacific Conference on Simulated Evolution And Learning (SEAL2002), Singapore; (pp 662-666). (ISBN 981-04-7523-3).
Personnel Rostering: STARK-Roster
This is a novel graphical
interface for personnel scheduling (nurse
rostering). The evaluations of the system showed
that novices could quickly learn to use the system and
were able to generate solutions of a quality to match an
expert scheduler. The design of the interface
reveals the underlying structure of the problem
constraints to users. White icons show constraints
that are more than satisfied, grey icons show constraints
that are just satisfied and black icons are unsatisfied
constraints. Hence, the solution can be improved by
finding areas that are black (e.g., centre 1/3 from the
bottom) and moving icons to areas that are white (e.g.,
the column 1/3 from the left).
Barone,
R., & Cheng, P. C.-H. (2004). Representations
for problem solving: on the benefits of integrated
structure. In E. Banissi, K. Börner, C. Chen, et al.
(Eds.), Proceedings of the 8th International Conference
on Information Visualisation (pp. 575-580). Los
Alamitos, CA: IEEE.
Production Planning and Scheduling: ROLLOUT
ROLLOUT was designed as a
system for diagrammatic production planning and scheduling
in factory-scale and in-store bakeries. The new
representations coherently encode all the information
needed for the planning of orders and the scheduling of
production. ROLLOUT diagrams reveal critical
relations as unique easily recognizable patterns.
Experienced bakery managers are able to see and exploit
these high-order regularities in their problem solving,
which were previously hidden. Novices are able to
create good schedules after a minimal amount of
training. The top half the diagram supports the
decomposition of orders (grey stacks) into to coordinated
batches of production of like products. The bottom
supports the allocation of production runs (staircases)
for batches of particular product types. Violations
of the plan, schedule and the physical plant constraints
are highlighted in red and can be simply resolved by
juggling the icons.
Cheng,
P. C.-H., & Barone, R. (2007). Representing
complex problems: A representational epistemic approach.
In D. H. Jonassen (Ed.), Learning to solve complex
scientific problems. (pp. 97-130). Mahmah, N.J.:
Lawrence Erlbaum Associates.
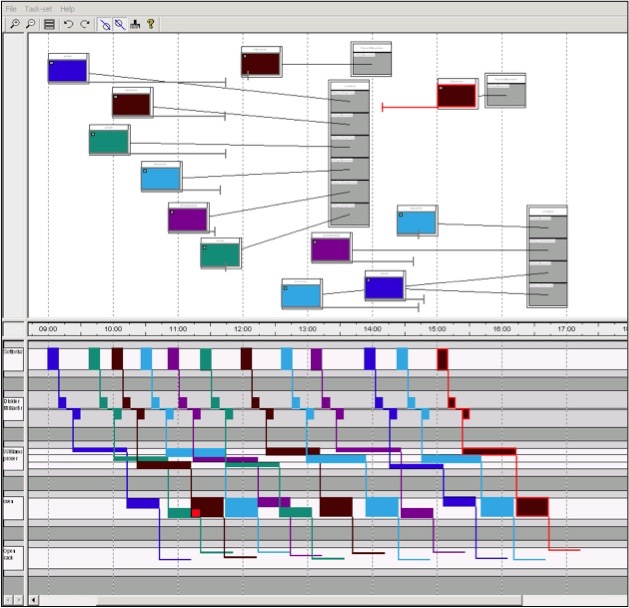
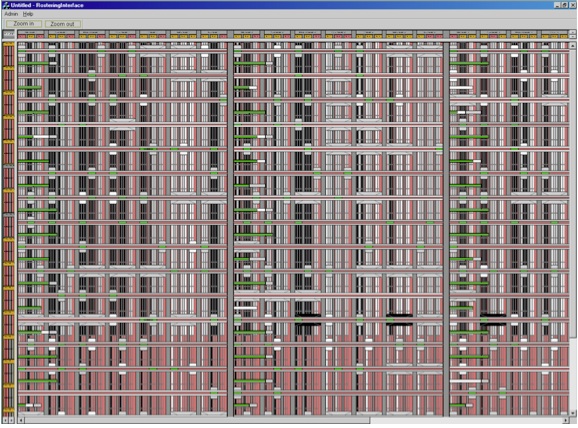
Integrating humans with automated scheduling systems:
VAST and KNIGHT
These systems were created in
order to explore methods by which human knowledge and
flexibility could be combined with the computational power
and information storage capabilities of computers, so that
each could compensate for the limitations of the
other. Both address the problem of examination
timetabling.
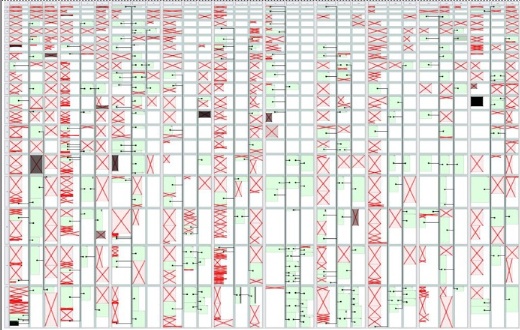
The VAST system (top) successfully used automatic pre-clustering of the raw data followed by human guided allocation and refined processes. By pre-clustering events, large numbers of constraints are automatically satisfied, which means that problem solvers can focus their attention on tricky constraints that would not normally be handled by standard evaluation functions and hence not addressed by an automated algorithm.
The KNIGHT system (bottom) demonstrated the feasibility of allowing humans to guide TABU optimization. To influence the potential of automated reallocation of events users could steer the algorithm in directions they considered to be potentially fruitful. They did this by inspecting visualizations of the solution process, using their own particular knowledge of the problem, and then varying the mobility of different classes of events so that some would be treated preferentially.
Ranson,
D., & Cheng, P. C.-H. (2008). VAST
Improvements to Diagrammatic Scheduling using
Representational Epistemic Interface Design. In G.
Stapleton, J. Howse & J. Lee (Eds.), Diagrammatic
Representation and Inference, Lecture Notes in
Aritificial Intelligence 5223 (pp. 141-155). Berlin:
Springer
Ranson, D. (2008). Interactive Visualisations to Improve Automated Scheduling Systems. PhD Thesis. (Contact Peter Cheng for a copy.)
Ranson, D. (2008). Interactive Visualisations to Improve Automated Scheduling Systems. PhD Thesis. (Contact Peter Cheng for a copy.)
Super-user
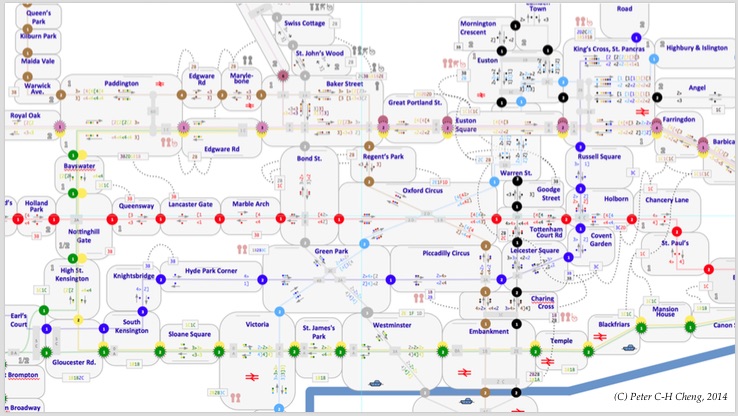
Transit Map (London Underground)
This transit map is designed
to capture information that special users of the London
Tube need to navigate efficiently around the
network. Such users include:
The design uses a container-node-symbol-colour format rather than the node-line-colour-symbol format of conventional transit maps.
- People with mobility impairments (e.g., wheel chair users)
- Sophisticated users who want to move efficiently
through the system (e.g., know where on a platform to
stand so they board the training in the right
carriage to be by the exit at their destination
station).
The design uses a container-node-symbol-colour format rather than the node-line-colour-symbol format of conventional transit maps.
Cheng, P.C-H. (2014). Beyond Beck: Design of schematic maps from (Representational Epistemic) first principles. Paper presented at the Schematic Mapping Workshop 2014, University of Essex. https://sites.google.com/site/schematicmapping/program