- Use the < rand > function to:
1. Create a matrix of uniformly distributed random numbers in the range [ 0 to 1 ] with 3 rows and 4 columns.
2. Create a matrix/ vector < v1 > of random numbers in the range [ -2 to +2 ] with 1 row and 200 columns.
3. Use the < hist > function to display a histogram of < v1 >.
Use the < randn > function to:
1. Create a vector called < v2 > of 400 normally distributed random numbers (ie. a 1 x 400 matrix).
2. Use the < hist > function to display a histogram of < v2 >. Compare this with the distribution of < v1 >.
- Distribution statistics:
1. Create the vector < v3 > containing the values: [ 3 1 4 6 2 7 2 5 ]
2. Find the mean/ average of the numbers in < v3 > - and call it < mean_v3 >.
3. Find the distance of each value in < v3 > from the mean by subtracting < mean_v3 > from < v3 > - call it < dist_from_mean >.
4. Square each value in the < dist_from_mean > vector (using the dot-notation) - call it < sq_dist_from_mean >.
5. Find the sum of the values in < sq_dist_from_mean > and divide this by < N-1 > (where < N > is number of values in < v3 >) - call it < variance_v3 >.
6. Find the square root of < variance_v3 > and call it < std_dev_v3 >.
7. Find out which functions in Matlab compute variance and standard deviation - and check your answers to the above.
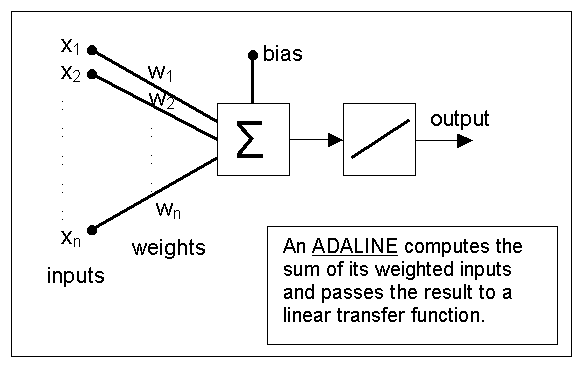
An ADALINE (ADAptive LINear Element) is a perceptron-like system with a linear transfer function (as opposed to the hard-limit transfer function in a perceptron).
The task is to train an ADALINE network to learn the association between the measurements of plants and plant-type given in the table below:
| Plant measurements (network inputs) | Plant-type (target outputs) | |||
| Height | Leaf area | Leaf length | Shrub | Tree |
| .1 | .4 | 1 | 1 | 0 |
| .2 | .5 | .5 | 1 | 0 |
| .7 | .5 | .2 | 0 | 1 |
| 1 | .9 | .7 | 0 | 1 |
| .6 | .8 | .9 | 0 | 1 |
- Create a function called < adaline > which takes one argument called < epochs >. (An epoch is a single pass through all of the training examples.)
- Create a matrix < x > of the inputs to the network using the values above, but ensuring that each column of the matrix holds one example. Add a bias value of 1 to each example input. This means < x > should be a matrix with 4 rows (3 inputs and 1 bias) and 5 columns (5 example inputs).
- Also create a (column-wise) matrix < t > of the target outputs with 2 rows and 5 columns.
- Create a matrix < w > of random weights in the range [ -0.1 to +0.1 ] to connect the 2 output units to the 4 input units (that's including bias).
- Set the learning rate < learn_rate > to 0.01.
- Using a for loop, iterate through all the < epochs > using the variable < e > to loop through < epochs >. Inside this for loop, set a variable called < error > to 0.
- Within each epoch iterate through the 5 input examples using a
looping variable < i > and do the following:
- Calculate the network outputs < y > and the delta errors < delta >. (eg. < y = w * x(:,i) > )
- Calculate the weight adjustments < wa > using the Widrow-Hoff learning rule < -learn_rate * delta * x(:,i)' >.
- Update the weights by adding < wa > to < w >.
- Add the sum of the squared error < d.^2 > to the variable called < error >.
Before the end of the 'epoch' loop, concatenate the error for that epoch < e > onto a vector: < all_error(e) = error >.
Make < all_error > the variable which is returned by the function < adaline >.
Save the function as < adaline.m >.
Now train the adaline for 100 epochs by typing < error = adaline(100) > at the command line.
Plot the error to see how it changes with each epoch.
Try changing the learning rate to 0.1 and to 0.001, and see how this affects the error plot.
-
(optional) Modify your function adaline so that it only runs for the number of epochs necessary to reach an acceptable error: the acceptable error should be the argument and the number of epochs the output.
-
(optional) Test your trained classifier: Is it classifying properly?
-
(optional) Compare this online method to batch processing method. In the batch processing method you only modify the weights after each epoch, not after each example. (at each epoch, you summate or average the errors...).
The following data is a record of the heights of children from ages 1 to 5:
| Age | C1 | C2 | C3 | C4 | C5 | C6 | C7 | C8 | C9 | C10 |
| 1 | 44.00 |
42.00 |
51.00 |
43.00 |
47.00 |
40.00 |
39.00 |
45.00 |
42.00 |
48.00 |
| 2 | 61.00 |
63.00 |
65.00 |
59.00 |
58.00 |
59.00 |
62.00 |
56.00 |
61.00 |
57.00 |
| 3 | 64.00 |
71.00 |
68.00 |
67.00 |
67.00 |
63.00 |
72.00 |
62.00 |
68.00 |
69.00 |
| 4 | 72.00 |
80.00 |
78.00 |
73.00 |
75.00 |
71.00 |
90.00 |
79.00 |
84.00 |
81.00 |
| 5 | 94.00 |
101.00 |
98.00 |
96.00 |
103.00 |
89.00 |
110.00 |
94.00 |
100.00 |
97.00 |
Load the data into matlab from the file heights.dat and plot the heights as they vary with age.
Use a matlab function to calculate the correlation coefficients between age and height.
Look at the matlab demos for 3D visualisation using the command < graf2d2 >.
Create a surface graph of the < heights > data you loaded into matlab for Question 3.
Create two grids of x- and y-coordinates using < [X,Y] = meshgrid(-8:.5:8); >.
The function < Z = cos(X/2) + sin(Y/4); > describes how Z varies with X and Y.
Use a 3D graph to display Z. Change the colormap to 'hot', and make a surface plot with interpolated shading.