- Write a function to create a grid of x- and y-coordinates:
Create a function called < grid2D > which takes four arguments < x1, x2, y1, y2 >
and returns two matrices: < [xgrid, ygrid] >. The < xgrid > matrix has only the
x-coordinates for the whole grid, and the < ygrid > matrix has only the y-coordinatesThe function can call the built-in matlab function < meshgrid > to create the two grids.
The rows of < xgrid > are ( y2 - y1 ) copies of the vector < x1:x2 > ;
and columns of < ygrid > are ( x2 - x1 ) copies of the vector < y1:y2 >.Test the function with:
[xg, yg] = grid2D(-4, 4, -3, 3)
The output should be:
xg =

    -4    -3    -2    -1     0     1     2     3     4
    -4    -3    -2    -1     0     1     2     3     4
    -4    -3    -2    -1     0     1     2     3     4
    -4    -3    -2    -1     0     1     2     3     4
    -4    -3    -2    -1     0     1     2     3     4
    -4    -3    -2    -1     0     1     2     3     4
    -4    -3    -2    -1     0     1     2     3     4


yg =

    -3    -3    -3    -3    -3    -3    -3    -3    -3
    -2    -2    -2    -2    -2    -2    -2    -2    -2
    -1    -1    -1    -1    -1    -1    -1    -1    -1
     0     0     0     0     0     0     0     0     0
     1     1     1     1     1     1     1     1     1
     2     2     2     2     2     2     2     2     2
     3     3     3     3     3     3     3     3     3
Copy the function below that performs a dilation (save as dilation.m):
function [xvelocity, yvelocity] = dilation(xgrid, ygrid, dilation_factor) M = [dilation_factor 0; 0 dilation_factor]; % The matrix to perform a dilation with % a magnitude of 'dilation_factor'. for i=1:size(xgrid,1) for j=1:size(xgrid,2) % at each point on the grid multiply M by % the column-vector of that co-ordinate velocity = M * [xgrid(i,j); ygrid(i,j)]; % put the results into the x-velocity and % y-velocity vectors, to return xvelocity(i,j) = velocity(1); yvelocity(i,j) = velocity(2); end end- Create a function to plot the flow field:
The function < flowfield > should take four arguments < xpos, ypos, xvel, yvel >.
< xpos > is a matrix of x-coordinates and < ypos > a matrix of y-coordinates,
in the format given by the grid2D function.< xvel > is a matrix of velocities in the x-direction
< yvel > is a matrix of velocities in the y-direction.Use the built-in function < quiver > to draw the flow-field.
- Use the three functions to plot a dilation flow-field:
[xg, yg] = grid2D(-4, 4, -3, 3); [xv, yv] = dilate(xg,yg,.5); flowfield(xg,yg,xv,yv) - Create a function to produce a rotation mapping:
Copy the < dilate > function, change the function name to < rotate > and change the matrix < M >
to give an anticlockwise rotation mapping (see slide 4 of MTCS 8 in the notes).
The < dilation_factor > can become a < rotation_factor >.Add an extra binary argument to the function to decide whether the rotation should be clockwise
or anticlockwise. Change the matrix M accordingly.Optional: also try the two different shear mappings in the notes.
Create a function < ff_net > which creates a fully-connected
feed-forward network.
Three arguments to the function specify the number
< i > of input nodes, < h > hidden nodes and <
o > outputs.
For example, a network with 100 inputs, 30 hidden nodes and 1 output would have the architecture
shown below:
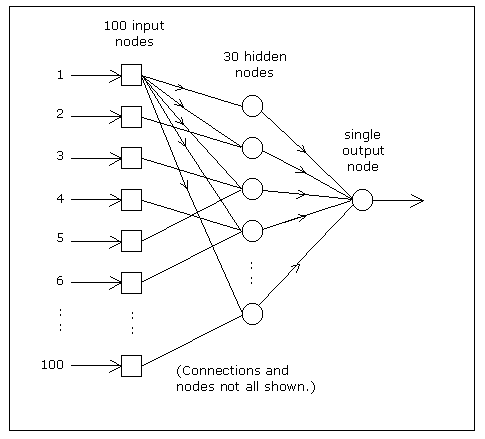
The function should return 2 matrices which correspond to the weights on
the input layer and hidden layer.
The weights can be initialised using the
built-in < randn > function.
Optional: create a function to calculate the network output, given its input
Create a new function < net_input > which has one argument, < input > which is a vector
(a matrix with one row) - a single set of inputs to the network.
The < net_input > function should call the < ff_net > function to create a network with
5 inputs, 3 hidden nodes and 1 output.
The < net_input > function should then use the weight matrices returned by the
< ff_net > function to calculate the activation of the hidden nodes.
(Hint: Use matrix multiplication to multiply the < inputs > by the < weights > )
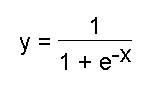
Calculate the output of the hidden nodes using the logistic sigmoid function
where x is the activation.
In a similar manner calculate the output of the output node, and make this
the value that the < net_input > function returns.
Now test the function with the input [1 2 1 4 3].