Experiment 1 materials and PF
For the materials of experiment 1 we calculated for each test tone row the
mean number of times each element in it matched an element in the training tone
rows, the mean number of times each bigram in it matched a bigram in the training
tone rows, and the same for trigrams and tetragrams. For the elements considered
as pitch classes or pitch class intervals, the means (and standard deviations
over tone rows) for the grammatical and non-grammatical tone rows are shown
in Tables 1-4 . Note that by virtue of being serialist tone rows, the grammatical
and non-grammatical items have identical first order frequencies of each pitch
class.
T-tests were performed on each corresponding difference between grammatical
and non-grammatical test items, indicating some imbalances.
Table 1
Mean n-gram match between test and training items for the transpose materials
of experiment 1. Standard deviations in parentheses.
| uni-grams | bigrams | trigrams | tetragrams | ||
| pitch classes | grammatical | . | 4.7 (0.9) | 0.6 (0.3) | 0.6 (0.4) |
| non-grammatical | . | 4.5 (0.7) | 0.5 (0.2) | 0.6 (0.3) | |
| pitch class intervals | grammatical | 55.3* (4.9) | 6.5* (1.7) | 1.0 (0.9) | 0.2 (0.4) |
| non-grammatical | 42.8 (3.2) | 5.4 (1.1) | 0.7 (0.3) | 0.1 (0.1) | |
Note: *The grammatical and non-grammatical items differ at the .05 level, t(48)
= 10.59 for the unigrams and t(48) = 2.47 for the bigrams.
Table 2
Mean n-gram match between test and training items for the inverse materials
of experiment 1. Standard deviations in parentheses.
| uni-grams | bigrams | trigrams | tetragrams | ||
| pitch classes | grammatical | . | 4.5 (0.7) | 0.5 (0.3) | 0.6 (0.3) |
| non-grammatical | . | 4.6 (0.5) | 0.5 (0.2) | 0.5 (0.3) | |
| pitch class intervals | grammatical | 53.7* (2.1) | 5.7 (1.1) | 0.7 (0.5) | 0.1 (0.2) |
| non-grammatical | 42.4 (2.3) | 5.4 (0.7) | 0.6 (0.3) | 0.1 (0.1) | |
Note: *The grammatical and non-grammatical items differ at the .05 level, t(48) = 18.39 for the uni-grams.
Table 3
Mean n-gram match between test and training items for the retrograde materials of experiment 1. Standard deviations in parentheses.
| uni-grams | bigrams | trigrams | tetragrams | ||
| pitch classes | grammatical | . | 4.0 (0.9) | 0.4 (0.4) | 0.4 (0.4) |
| non-grammatical | . | 4.1 (0.9) | 0.4 (0.2) | 0.5 (0.2) | |
| pitch class intervals | grammatical | 50.0* (1.5) | 5.1 (0.6) | 1.2* (0.5) | 0.2*(0.3) |
| non-grammatical | 39.8 (1.8) | 4.8 (0.5) | 0.4 (0.2) | 0.1 (0.1) | |
Note: *The grammatical and non-grammatical items differ at the .05 level, t(48) = 21.87 for the unigrams; t(48) = 6.94 for the trigrams; and t(48) = 2.16 for the tetragrams.
Table 4
Mean n-gram match between test and training items for the inverse retrograde materials of experiment 1. Standard deviations in parentheses.
| uni-grams | bigrams | trigrams | tetragrams | ||
| pitch classes | grammatical | . | 4.6 (0.8) | 0.5 (0.3) | 0.6 (0.3) |
| non-grammatical | . | 4.5 (0.6) | 0.4 (0.2) | 0.5 (0.2) | |
| pitch class intervals | grammatical | 55.0* (5.0) | 6.1 (1.7) | 0.9 (0.7) | 0.1 (0.2) |
| non-grammatical | 43.1 (3.4) | 5.6 (1.1) | 0.8 (0.3) | 0.1 (0.1) | |
Note: *The grammatical and non-grammatical items differ at the .05 level, t(48) = 9.80 for the unigrams.
The transforms in experiment 1 showed consistent imbalances in unigrams. Could this have been the basis of PF's implicit knowledge? To check this possibility, we considered every response that PF regarded as a guess (for all transforms) and determined whether first order frequencies of intervals (unigrams) could predict PF's responses. The mean unigram match for each test item given a "guess" confidence rating was compared to the average unigram match for all items in that test set. If PF was responding on the basis of unigrams he should say "yes" more often to items with high unigram matches than low uni-gram matches. In fact, unigram match predicted PF's responses 60% of the time. (For the same items, the transform that the item instantiated predicted 62% of PF's answers.) (Bigram matches predicted his responses 52% of the time.) It is possible therefore that PF's responses were based on first order frequencies of intervals; the data do not distinguish this possibility from the idea that PF could use implicit knowledge of the transforms themselves. A multiple logistic regression with both unigrams and transform (coded 0 for no transform and 1 for any of the transforms being instantiated) as predictors of PF's responses showed non-significant effects of both variables when both were in the equation; thus, we do not know if each variable contributed independently to PF's responses.
Experiments 2a and 2b
In experiments 2a and 2b, the materials were extremely well balanced in terms
of their n-gram structure, at least up to tetragrams, as seen in Tables 5 and
6.
Table 5.
Mean n-gram match between test and training items for the materials of experiment 2a. Standard deviations in parentheses.
| uni-grams | bigrams | trigrams | tetragrams | ||
| pitch classes | grammatical | . | 3.7 (0.8) | 0.4 (0.3) | 0.5 (0.3) |
| non-grammatical | . | 3.6 (0.7) | 0.4 (0.2) | 0.4 (0.3) | |
| pitch class intervals | grammatical | 43.9 (4.7) | 5.7 (1.8) | 1.9 (1.2) | 1.0 (1.0) |
| non-grammatical | 44.3 (4.8) | 5.6 (1.8) | 2.0 (0.9) | 1.0 (0.5) | |
Table 6.
Mean n-gram match between test and training items for the materials of experiment
2b. Standard deviations in parentheses.
| uni-grams | bigrams | trigrams | tetragrams | ||
| pitch classes | grammatical | . | 3.7 (0.6) | 0.5 (0.3) | 0.5 (0.3) |
| non-grammatical | . | 3.9 (0.7) | 0.5 (0.4) | 0.6 (0.5) | |
| pitch class intervals | grammatical | 44.9 (4.7) | 5.9 (1.5) | 2.0 (0.8) | 1.0 (0.5) |
| non-grammatical | 44.9 (4.6) | 6.2 (1.2) | 2.0 (0.6 | 1.1 (0.5) | |
Various of the n-gram statistics actually (non-significantly) favoured non-grammatical
rather than grammatical items. To provide further evidence that n-grams were
not the basis of participants' responses, in experiment 2a we looked at how
the experienced participants performed on the first and last half of test items.
For the last half of test items the interval unigram, bigram, trigram and tetragram
scores were, by chance, (non-significantly) higher for non-grammatical rather
than grammatical items; for the first half of test items, by contrast, bigram
and trigram statistics (non-significantly) favoured grammatical rather than
non-grammatical items. The mean classification performance on the last half
was 55% (SE = 3.3%), little different than performance on the first half of
test items (57%, SE= 3.3%, t <1).
Even though participants in experiments 2a and 2bcould not have been using n-gram
statistics where n-grams are defined independently of position, maybe participants
were responsive to n-grams in particular positions (e.g. Knowlton & Squire,
1994; Johnstone & Shanks, 1999). Tables 7 and 8 show how well the 48 test
items could have been classified just using n-grams in each position.
Table 7
Classification (/48) using n-gram intervals starting at position X
Materials for experiment 2a
| X | unigram | bigram | trigram |
| 1 | 28 | 19 | 22 |
| 2 | 20 | 22 | 22 |
| 3 | 25 | 22 | 22 |
| 4 | 25 | 24 | 32 |
| 5 | 20 | 36 | 40 |
| 6 | 37 | 34 | 32 |
| 7 | 23 | 15 | 19 |
| 8 | 19 | 17 | 20 |
| 9 | 25 | 20 | 20 |
| 10 | 22 | 21 | |
| 11 | 23 | ||
| mean | 23.9 (49.8%) | 23.0 (47.9%) | 25.4 (53.0%) |
Table 8
Classification (/48) using n-gram intervals starting at position X
| X | unigram | bigram | trigram |
| 1 | 20 | 29 | 26 |
| 2 | 28 | 26 | 26 |
| 3 | 23 | 26 | 26 |
| 4 | 23 | 24 | 33 |
| 5 | 28 | 39 | 43 |
| 6 | 30 | 37 | 33 |
| 7 | 25 | 22 | 17 |
| 8 | 21 | 21 | 20 |
| 9 | 23 | 20 | 16 |
| 10 | 18 | 20 | |
| 11 | 20 | ||
| mean | 23.5 (49.0%) | 26.4 (55.0%) | 26.8 (55.7%) |
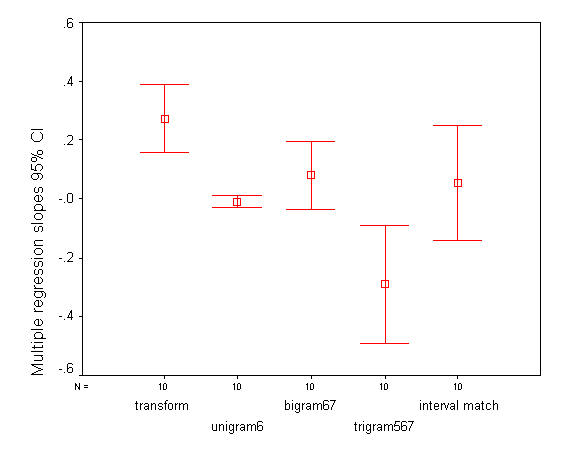
Relying on n-grams in a particular position would actually lead to below baseline classification approximately as often as above baseline classification. However, if the n-gram spans the central position of the tone row, very good classification can be achieved. For each n-gram, the position that allows best classification was chosen and the corresponding n-gram match was entered into a multiple regression to predict each participant's responses. Some of the test items also had the same interval sequence as one of the training items. A binary variable coding whether there was an interval match with a training item was also entered. Whether the test item was a transpose or inverse retrograde was also entered. The dependent variable was a 1 or a 0, depending on whether the participant endorsed that item or not. Figure 1 shows the regression slopes for the experienced participants of experiment 2a and figure 2 shows the regression slopes for the postgraduates and faculty of experiment 2b (confidence intervals calculated over participants).
Figure 1. Multiple regression coefficients for predicting the responses of the experienced participants in experiment 2a.
Figure 2. Multiple regression coefficients for predicting the responses of
the postgraduates and faculty in experiment 2b.
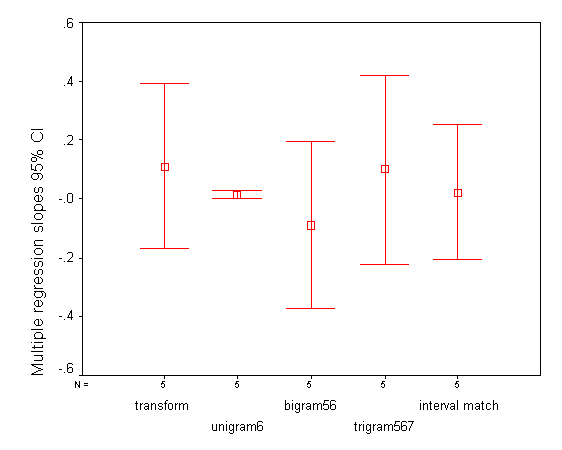
Figure 1 shows that in experiment 2a the transform remained a reliable predictor
of participants' responses, partialing out all the other variables. Participants
seemed to be sensitive to the transform independently of the n-gram variables.
The results for experiment 2b were inconclusive; the effect of transform was
non-significant, but the confidence interval was also wide enough to include
the size of slope found in experiment 2a. With only five participants, the data
do not allow us to say exactly what the participants were responding to.
Brooks and Vokey (1991) argued that participants could be sensitive to matches
in the repetition structure between test and training items. For example, the
letter string MMXMTX has the repetition structure 112132 indicating that the
first element is repeated in the second and third positions and the second novel
element is repeated in the final position (see also e.g. Tunney & Altmann,
2001). For the stimuli in experiment 2a, no pitch class is repeated, so the
repetition structure over pitch classes is identical for all tone rows in the
test phase. The repetition structure over pitch class intervals was determined
for the training and test tone rows. For each test tone row, the number of times
its repetition structure matched that of a training tone row was determined.
In fact, this allowed perfect discrimination between the transposes and inverse
retrogrades in the test set. For the inverse retrogrades, each tone row had
zero matches with transpose training tone rows. Transposes had between 1 and
20 matches. When the number of matches was entered into a multiple regression,
together with transform and the n-gram statistics entered in the regression
reported in the text, with participant's response as the dependent variable,
transform remained a highly significant predictor (its regression coefficient
was positive for all 10 experienced participants, so p =(0.5)^10 by binomial,
1-tailed); repetition structure match had in fact an overall negative regression
slope. In sum, transform remains a significant predictor of participants' responses
when repetition structure is partialed out.
Finally, we looked at wether participants could be using the contour to pick
out transposes. Because of the use of modulo 12 arithmetic in forming the transpose,
the contour is changed as compared to that expected from a normal pitch transpose.
In the latter case, the contour of the second hexachord is identical to that
of the first. For each test tone row, the number of times corresponding pitch
(not pitch class) intervals in the first and second hexachords had the same
sign was counted. If the contour of the first hexachord had been preserved in
the second, this count would be 5. In fact, for the transposes, this count varied
between 2 and 5; for the inverse retrogrades it varied between 1 and 5. This
count, together with transform (0=inverse retrograde, 1=transpose) were entered
as predictors in a multiple regression for each experienced participant in experiment
2a, predicting their response as the dependent variable. For 9 out of 10 participants
the slope for transform remained positive, significant over participants by
sign test, p =.011, 1-tailed; also for 9 out of 10 participants, the contour
count has a positive slope, significant over subjects by sign test. Thus, both
variables significantly contributed to how participants responded.