Particle Collision:
Huygens and Wren's 1D Diagrams extended
Huygens and Wren created
diagrams to model the conservation of momentum and energy
in 1D (head on) elastic collisions. We have extended
these diagrams to model 2D collision, inelastic impacts
and glancing interactions. The diagrams use
geometric constraints to encode the conservation
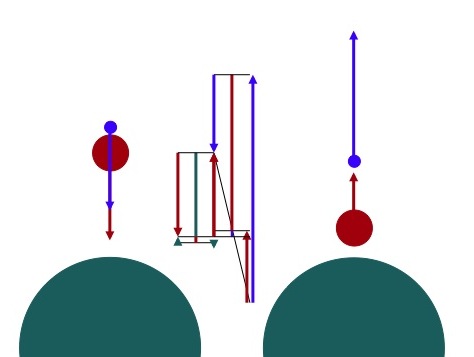
laws. This diagram shows an amplified rebound
situation. Hold a table tennis ball (blue) above a
gulf ball (red) and drop them both on to the floor
(green). How high will the table tennis ball
rebound? Surprisingly, it will be much higher than
the altitude from which they are dropped.
Interactive examples
Cheng, P. C.-H. (1996). Scientific discovery with law encoding diagrams. Creativity Research Journal, 9(2&3), 145-162.
Cheng, P. C.-H. (1996). Learning qualitative relations in physics with Law Encoding Diagrams. In G. W. Cottrell (Ed.), Proceedings of the Eighteenth Annual Conference of the Cognitive Science Society (pp. 512-517). Hillsdale, NJ: Lawrence Erlbaum.
Cheng, P. C.-H., & Simon, H. A. (1995). Scientific discovery and creative reasoning with diagrams. In S. Smith, T. Ward & R. Finke (Eds.), The Creative Cognition Approach (pp. 205-228). Cambridge, MA: MIT Press.
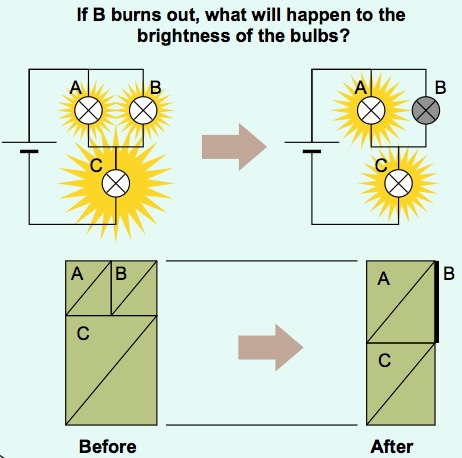
Electricity: AVOW diagrams
AVOW (Amps, Volts, Ohms and
Watts) diagrams were invented to model electrical
circuits. They show values of the four electrical
properties and encode Ohm's law, the power law and both of
Kirchhoff's laws in the geometric and topological
structure of the diagram. AVOW diagrams
substantially improve problem solving and learning of
electricity compared to conventional algebra based
approaches. The example shows how current and
voltage are both redistributed when one lamp in a circuit
burns out.
Cheng, P.
C.-H. (2002). Electrifying diagrams for learning:
principles for effective representational systems.
Cognitive Science, 26(6), 685-736.
Cheng, P. C.-H., & Shipstone, D. M. (2003). Supporting learning and promoting conceptual change with box and AVOW diagrams. Part 1: Representational design and instructional approaches. International Journal of Science Education, 25(2), 193-204.
Cheng, P. C.-H., & Shipstone, D. M. (2003) . Supporting learning and promoting conceptual change with box and AVOW diagrams. Part 2: Their impact on student learning at A-level. International Journal of Science Education, 25(3), 291-305.
Shipstone, D. M., & Cheng, P. C.-H. (2002). Electric circuits: A new approach - part 2. School Science Review, 83(304), 73-81.
Shipstone, D. S., & Cheng, P. C.-H. (2001). Electric circuits: A new approach - part 1. School Science Review, 83(303), 55-63.
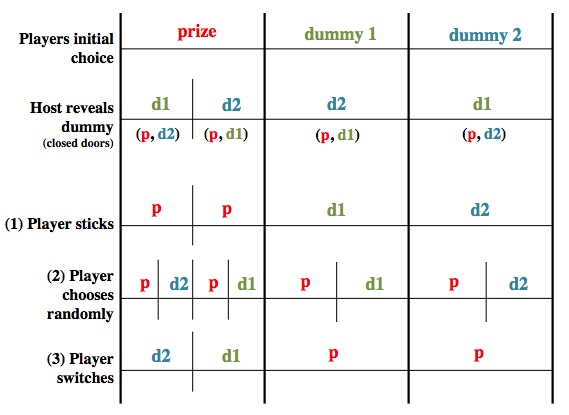
Probability+set
theory: Probability Space diagrams
Probability space (PS)
diagrams integrate set theoretic ideas with the axioms and
laws of probability theory. PS diagrams
substantially improve problem solving and learning of
probability theory compared to conventional algebra based
approaches. The diagram shows the solution to the
infamous Monty Hall dilemma.
Interactive examples
Cheng, P. C.-H. (2011). Probably good diagrams for learning: Representational epistemic re-codification of probability theory Topics in Cognitive Science 3(3), 475-498. doi: 10.1111/j.1756-8765.2009.01065.x
Cheng, P. C. H. (2003). Diagrammatic re-codification of probability theory: A representational epistemological study. In Proceedings of the Twenty Fifth Annual Conference of the Cognitive Science Society. Mahwah, NJ: Lawrence Erbaum.
Cheng, P. C.-H., & Pitt, N. G. (2003). Diagrams for difficult problems in probability. Mathematical Gazette, 87(508), 86-97.
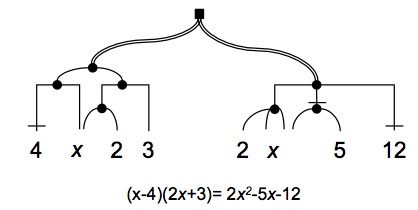
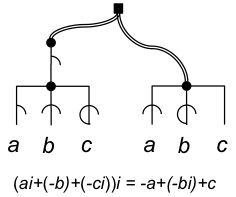
Algebra: HANDi - Hierarchical Algebra Network DIagrams
This notation system was
designed to make introductory algebra more comprehensible
and easier to learn. Its key features include: just
one occurrence of a letter for each type of variable in an
expression; explicit representation of the hierarchical
structure of expressions; distinct network patterns for
different types of relations; coherent integration of
imaginary numbers with real numbers. The top diagram
gives is a HANDi for a quadratic equation. The
bottom diagram shows how imaginary numbers are encoded in
a HANDi and makes transparent the relation between
imginary numbers and real positive and negative numbers.
To see a working paper contact Peter Cheng.
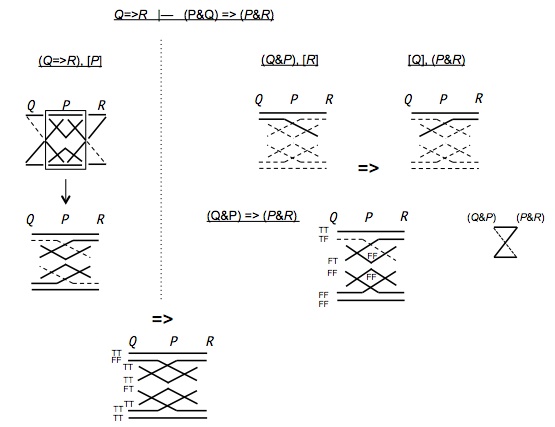
Propositional Logic: Truth Diagrams
Truth Diagrams, TDs, are
models of logical states of affairs that simultaneously
encode the assignment of truth-values to variables and the
truth-values of operators applied to those variables. TDs provide an
algorithmic approach to derivation of formulas and proofs
by the composition of its diagrams.
To see a working paper
contact Peter Cheng.